ES Thursday 10-13-11
I know many are getting new charts and becoming familiar with volume profiles. Here is the last two days for reference with the appropriate high and low volume marked off. This way those who are new can compare their charts to this one. Lots of good bell curves to work with once the 8:30 reports come out
Click image for original size
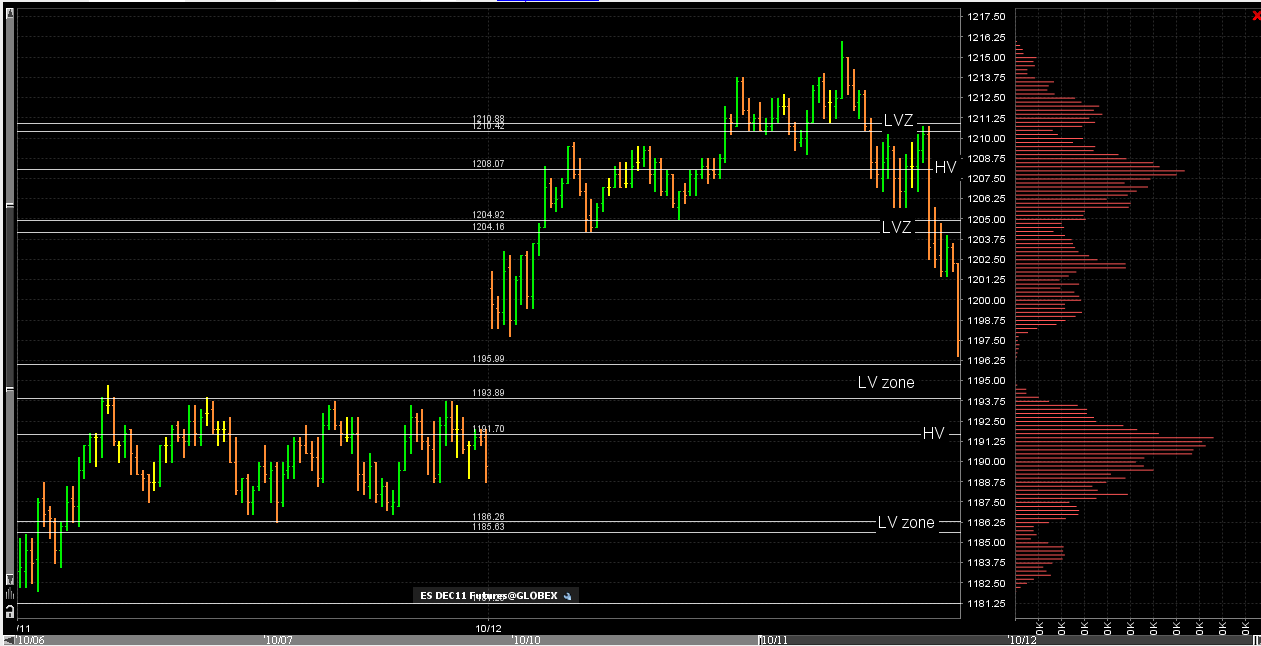
gonna be real interesting as they will break one of the hour ranges into one of our key number zones....hopefully with some air !! most likely the 96 as it is a probability to print.....but we will let the price action tell us what to look for

twice the 87.00 held
no question that buying the hour breakdown if it comes is high risk as we are accepting price in the lower zone of wednesdays session...and we are rejecting the 94 - 96 zone so far.....one plus is that we symetric in the developing day...
all volume is still at that 91 area we have been watching...
all volume is still at that 91 area we have been watching...
The tick chart is still neg for the day
10/9 and 10/10 profiles combined
Click image for original size
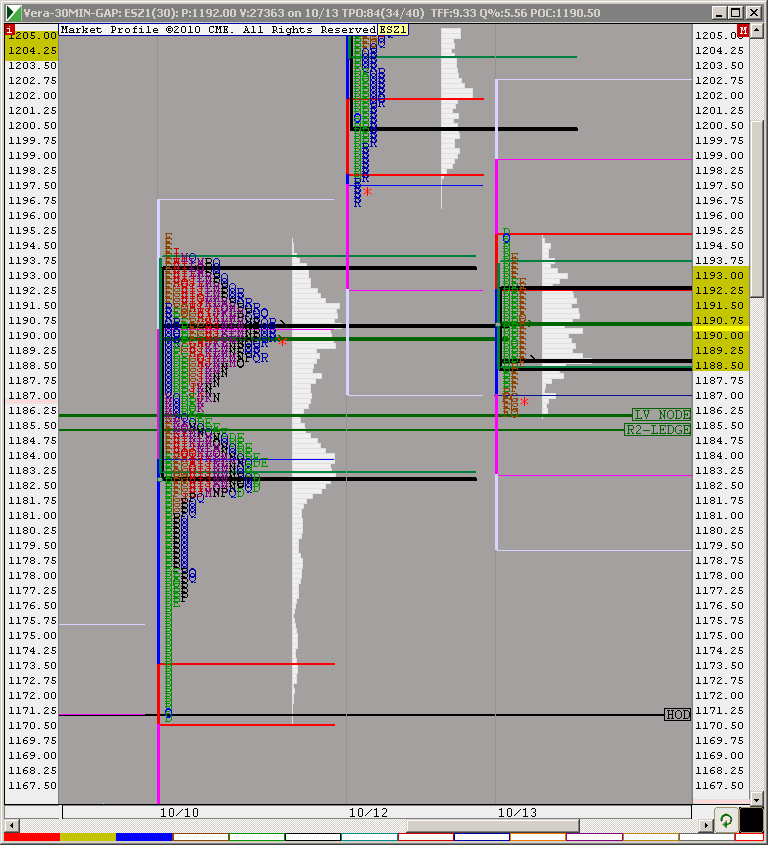
bruce would you use 83. as next level dow I have that as the next LV if this brakes
picking at longs at the 85.50 number...single prints are above to test
Lisa you read my mind
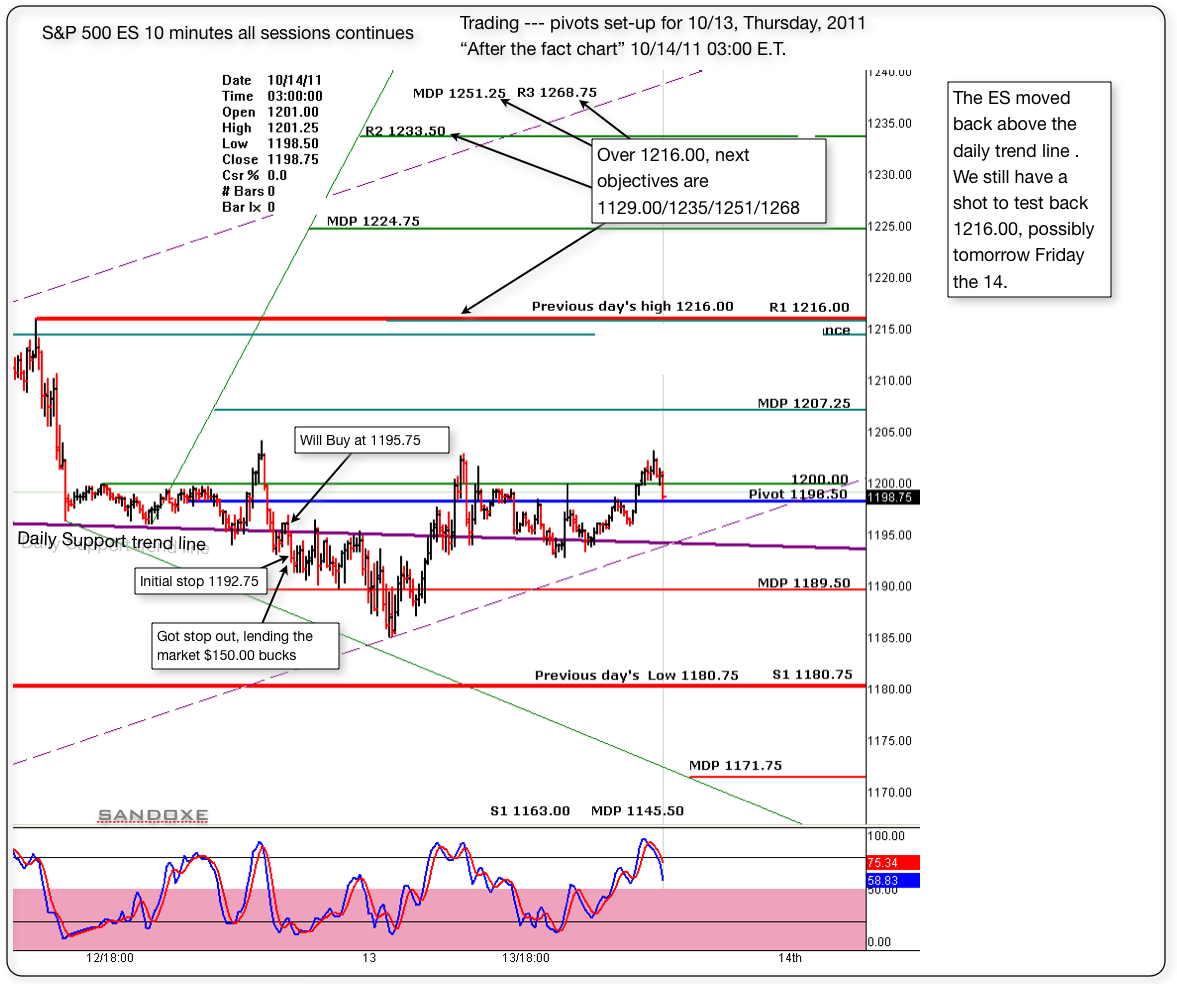
Below is the 10 minutes follow up chart or "after the fact chart" Today was not my day. After the first trade I knew it was best to stay away. Did one more trade and luckily got stop out at B.E. But, I still lend the market $150.00 for the day.
In trading, you will find, that, no matter what system you have, or how good of a trader you are, there will be days when you are not in the "zone" Those are days that it's better to close shop and go play.......
In trading, you will find, that, no matter what system you have, or how good of a trader you are, there will be days when you are not in the "zone" Those are days that it's better to close shop and go play.......
Click image for original size
Originally posted by sandoxe
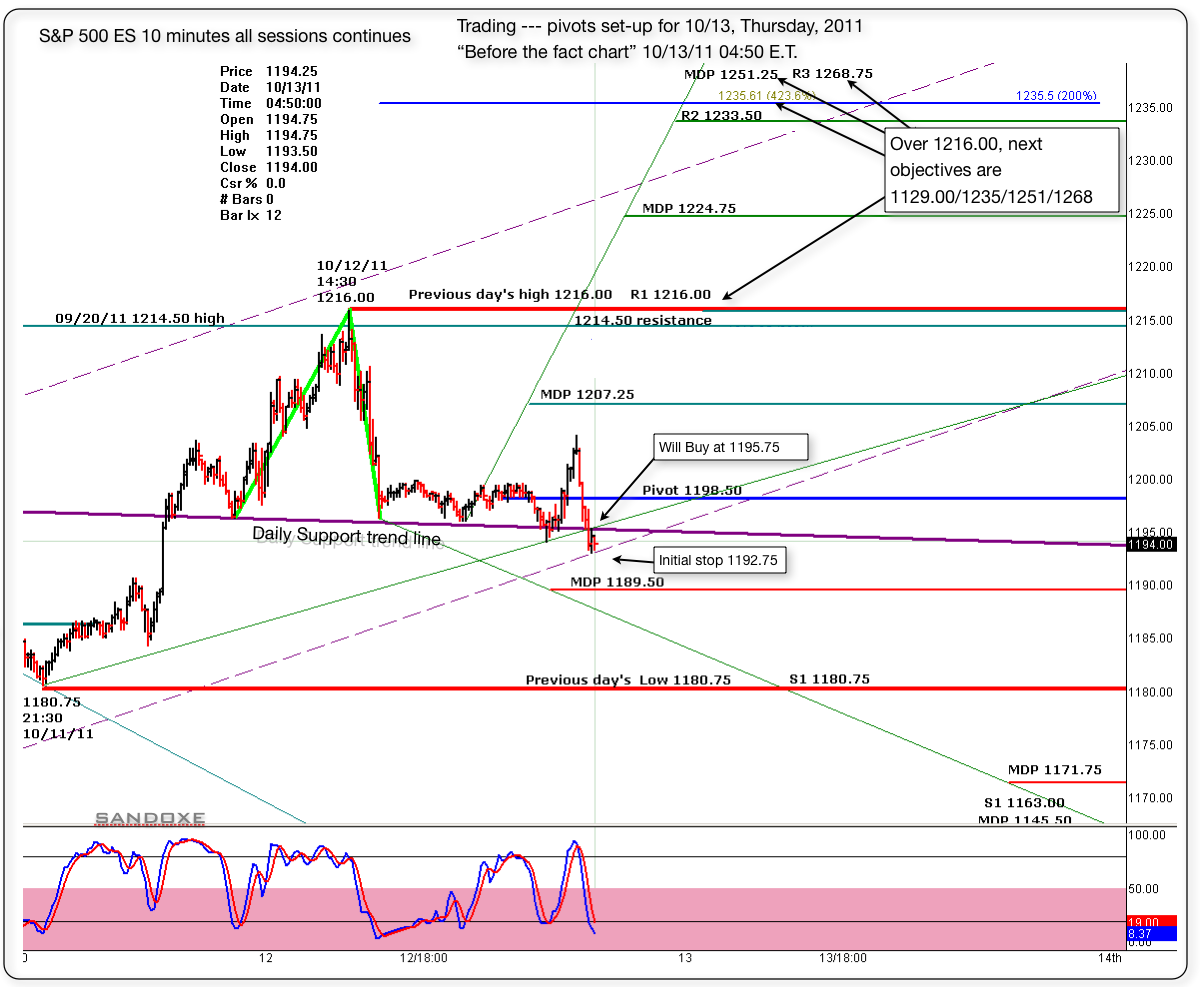
If the bulls still want to give it one more test to 1216, and possibly 1229 with good spike after that I'm Ok with it. Maybe today and tomorrow.
Below is the "before the fact chart" with the pivots set up for today. I'm buying at 1195.75, just above the daily trend line.
Initial stop at 1192.75.
Will see what the market has for us, and as always, the market has the last word and in due time will show us the way.
I see for you the same I see for my self: Having the best of luck and fun, awesome profitable trading day!
Click image for original size
Emini Day Trading /
Daily Notes /
Forecast /
Economic Events /
Search /
Terms and Conditions /
Disclaimer /
Books /
Online Books /
Site Map /
Contact /
Privacy Policy /
Links /
About /
Day Trading Forum /
Investment Calculators /
Pivot Point Calculator /
Market Profile Generator /
Fibonacci Calculator /
Mailing List /
Advertise Here /
Articles /
Financial Terms /
Brokers /
Software /
Holidays /
Stock Split Calendar /
Mortgage Calculator /
Donate
Copyright © 2004-2023, MyPivots. All rights reserved.
Copyright © 2004-2023, MyPivots. All rights reserved.