ES Thursday 10-13-11
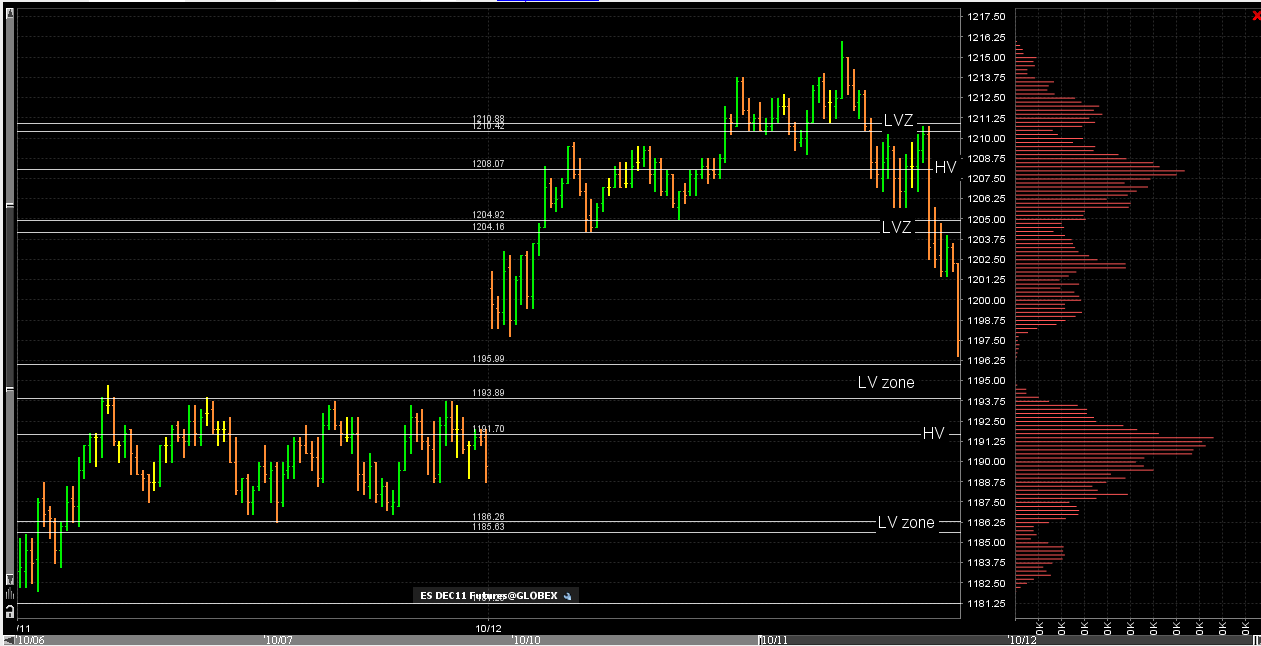
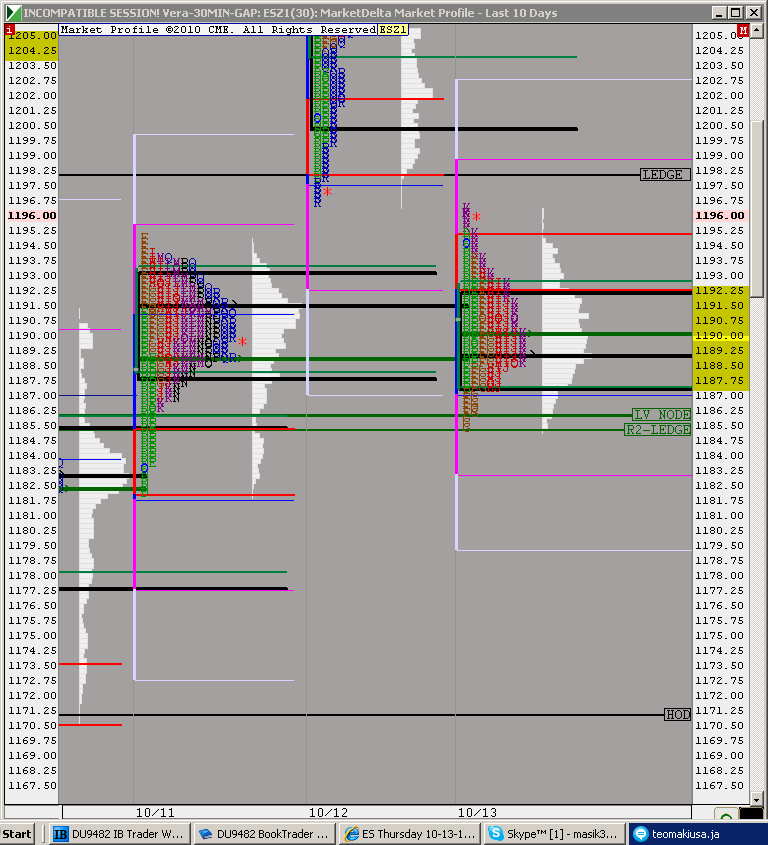
I know many are getting new charts and becoming familiar with volume profiles. Here is the last two days for reference with the appropriate high and low volume marked off. This way those who are new can compare their charts to this one. Lots of good bell curves to work with once the 8:30 reports come out
Click image for original size
if long, tgt 1= 98
Click image for original size
97. has seller ther foot prints say anything?
I see nothing, Della
Thanks lisaP
we can't go long into low volume when we approach it from below...91 needs work still
big mike...see how that rally started too early...for anyone else reading today....we are on both sides of the IB...that is a neutral day....low conviction of trend.....we broke out above our key 94- 96 and took out that overnight ledge at 97.50 mentioned earlier...we are sellers into that for the 94 - 96 retest automatically...a trade u gotta take
91 is still from yesterday and 92.75 is edge of TODAYS bell curve...neutral day still!!
Ok bruce what did you mean buy we cant go long into the low arae you just lost me
sorry to be so blunt...better rallies start around now but we still have to remember we are neutral and the peak volume price has not moved up yet..peak volume is still down at 89...price is not attracting volume at higher prices yet...a conceptual concept and harder to trade that information...still my odds machine has us dragging back down...in the 91 and the 89 to round out that bell curve
it will take volume to break away from that bell from the 11th...see lisa's chart...just like the way they couldn't break it down away from itthis morning...afternoons statistically have a better chance as trends begin and hold better then...but neutral days usually put low odds on the trend happening
does anyone understand that babble?? it may be complex...I've been at this too long and not sure i can always convey what I think clearly
does anyone understand that babble?? it may be complex...I've been at this too long and not sure i can always convey what I think clearly
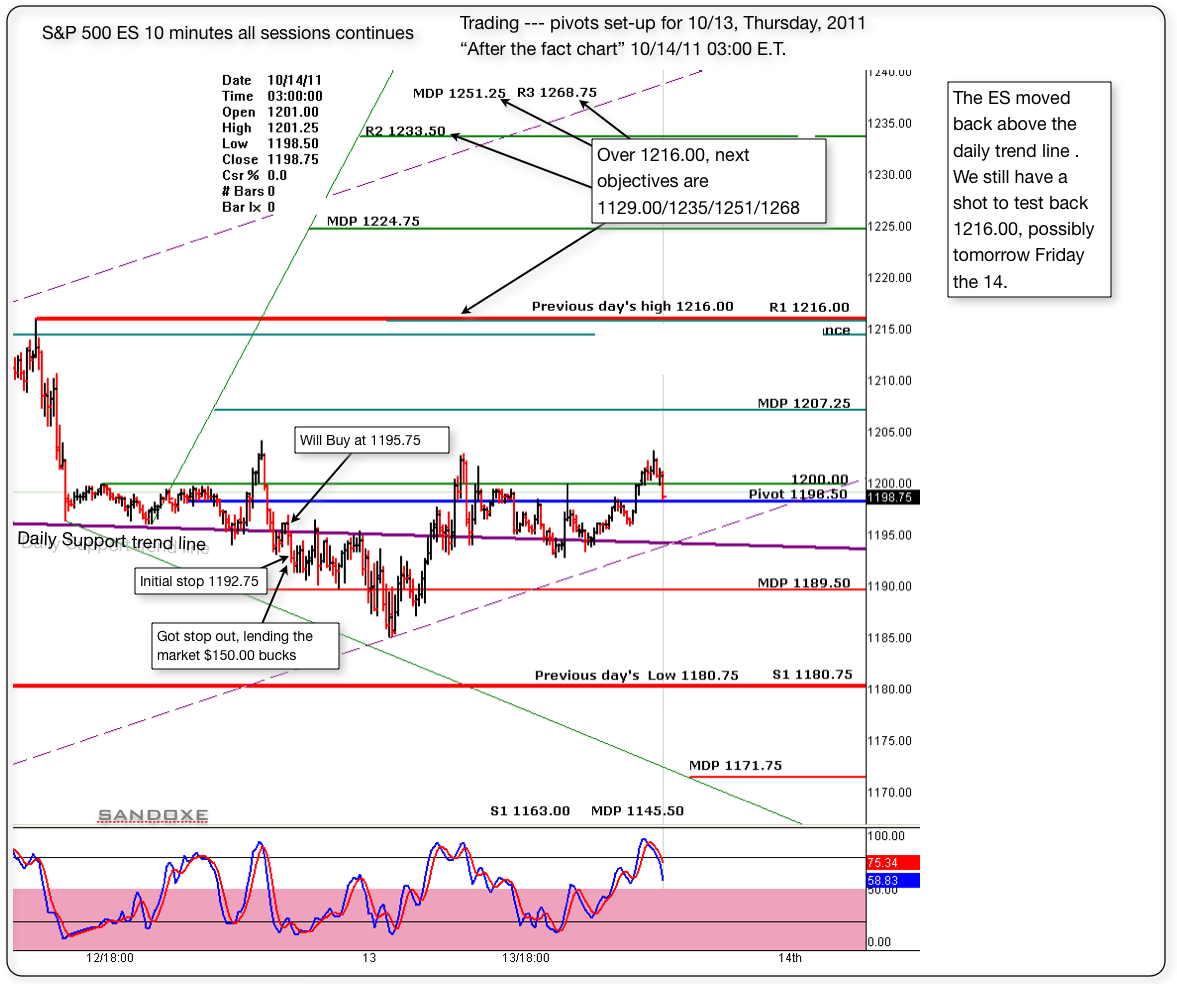
Below is the 10 minutes follow up chart or "after the fact chart" Today was not my day. After the first trade I knew it was best to stay away. Did one more trade and luckily got stop out at B.E. But, I still lend the market $150.00 for the day.
In trading, you will find, that, no matter what system you have, or how good of a trader you are, there will be days when you are not in the "zone" Those are days that it's better to close shop and go play.......
In trading, you will find, that, no matter what system you have, or how good of a trader you are, there will be days when you are not in the "zone" Those are days that it's better to close shop and go play.......
Click image for original size
Originally posted by sandoxe
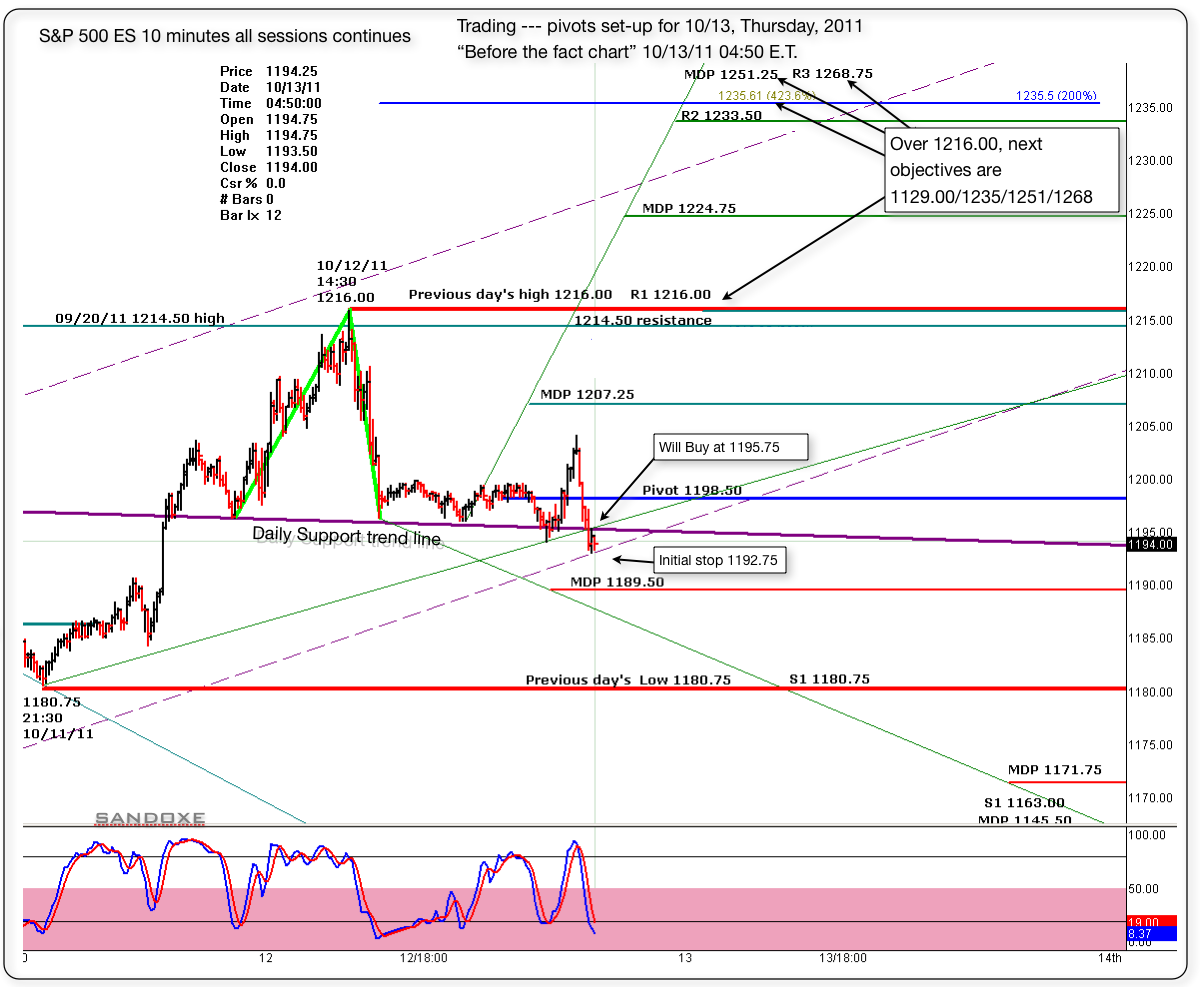
If the bulls still want to give it one more test to 1216, and possibly 1229 with good spike after that I'm Ok with it. Maybe today and tomorrow.
Below is the "before the fact chart" with the pivots set up for today. I'm buying at 1195.75, just above the daily trend line.
Initial stop at 1192.75.
Will see what the market has for us, and as always, the market has the last word and in due time will show us the way.
I see for you the same I see for my self: Having the best of luck and fun, awesome profitable trading day!
Click image for original size
Emini Day Trading /
Daily Notes /
Forecast /
Economic Events /
Search /
Terms and Conditions /
Disclaimer /
Books /
Online Books /
Site Map /
Contact /
Privacy Policy /
Links /
About /
Day Trading Forum /
Investment Calculators /
Pivot Point Calculator /
Market Profile Generator /
Fibonacci Calculator /
Mailing List /
Advertise Here /
Articles /
Financial Terms /
Brokers /
Software /
Holidays /
Stock Split Calendar /
Mortgage Calculator /
Donate
Copyright © 2004-2023, MyPivots. All rights reserved.
Copyright © 2004-2023, MyPivots. All rights reserved.