ES Thursday 10-13-11
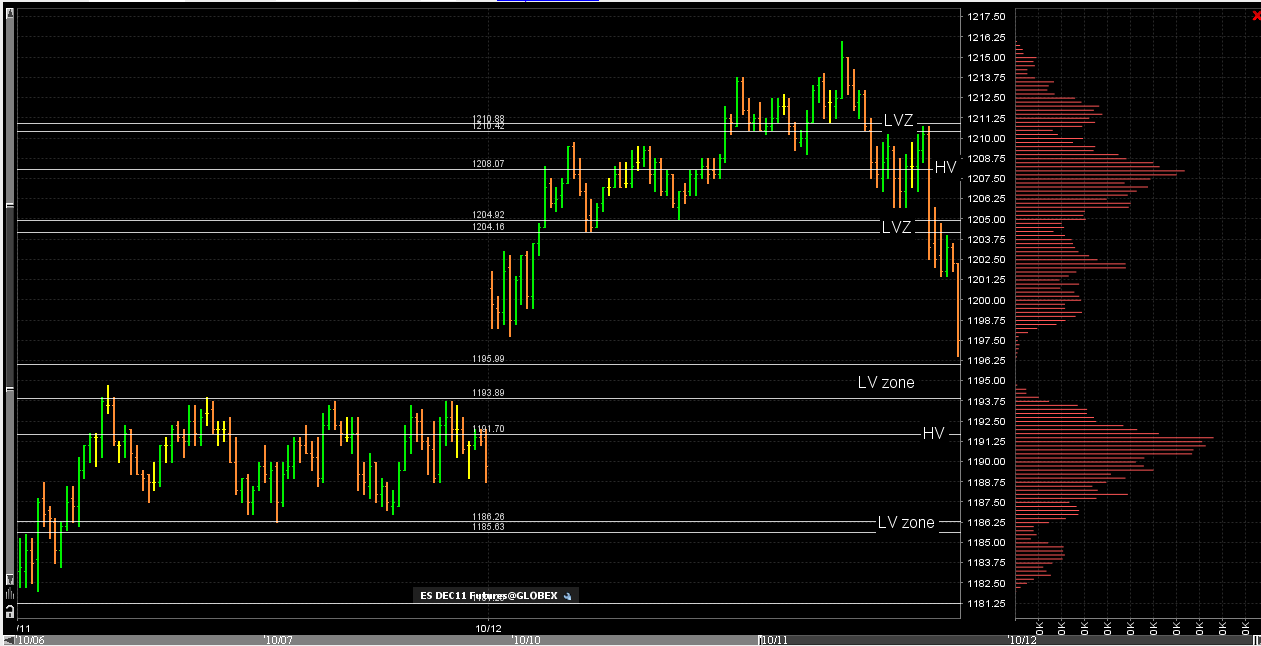
I know many are getting new charts and becoming familiar with volume profiles. Here is the last two days for reference with the appropriate high and low volume marked off. This way those who are new can compare their charts to this one. Lots of good bell curves to work with once the 8:30 reports come out
Click image for original size
so it should drag us back to 91 because they havent build up the Vol on higher numbers like 95 96
so it could say it was being exceptived
so it could say it was being exceptived
Della, we had an area marked...see my first chart today at 94 - 96...that is low volume...so holding long trades above that is higher risk especially if we haven't dropped back down to test it once we blow thorugh it from below...why would we hold long when we "KNOW" they come back to test those areas so often? get it..? let me know if u don't..I'll try harder!!
correct and more important is that the peak volume price from today is down at 89 when the peak volume price for 10-11 is UP at 1191....why is peak volume lower today? Because price is not officially accepted at higher prices yet...often that takes time..
Originally posted by della
so it should drag us back to 91 because they havent build up the Vol on higher numbers like 95 96
so it could say it was being exceptived
Got it guy thanks
I would have at least wanted to see peak volume flip up higher to 91 again but it hasn't happened yet......we'll see....they also will watch the edge of the 10-11 day....to see if price can hold above that edge...so we have a nice battle going into the end of the day....
another reason I am far less agressive in afternoon session...in th emorning we are really only dealing with previous days but as the current day wears on we have more information that can sometimes conflict...it makes trading more confusing
another reason I am far less agressive in afternoon session...in th emorning we are really only dealing with previous days but as the current day wears on we have more information that can sometimes conflict...it makes trading more confusing
this obviously doesn't mean that it WILL get tested della but that is the theory.....if we make new highs now then some will look at that as a good long to not fade as we have tested the low volume from 10-11 and it seems to now be holding...( the 94 - 96) they can't get below the 94 now.....so traders are conflicted....I'm still leaning on the short side until new highs come....if they do come at all..targeting that 91 and 89...but trading light...
so della that is the long winded way of saying I will look for shorts as long as we don't get new highs now.....LOL...new highs will have me go neutral and will not trade anymore today
we are getting lower highs on the tick
We are filling the thinly-traded area. Mini bell possible here.
No mojo today.
No mojo today.
Click image for original size
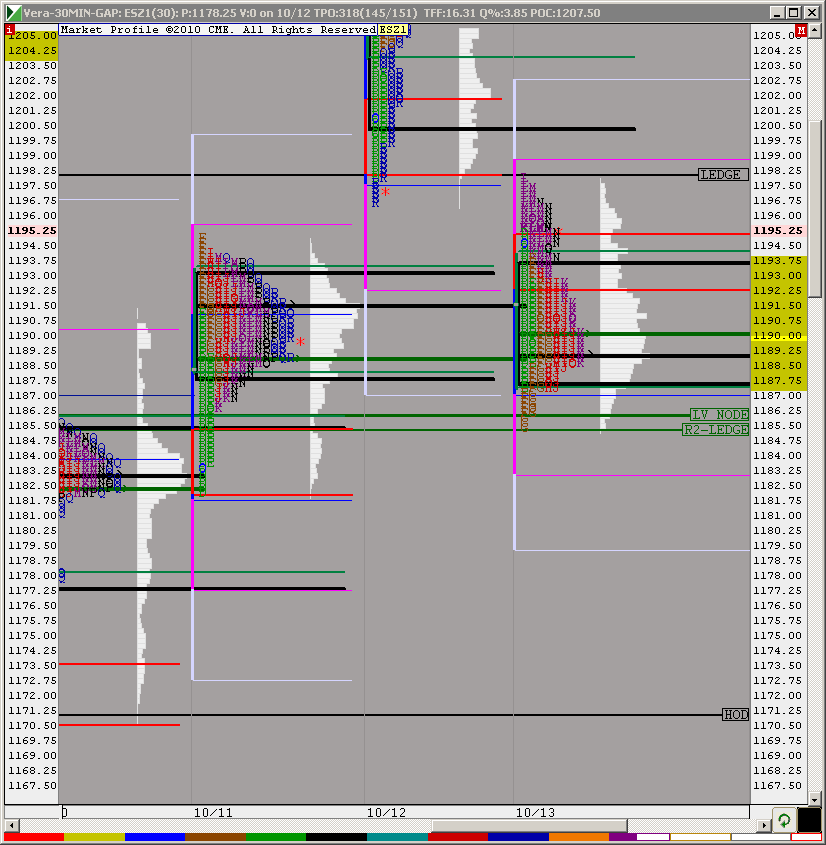
lisa chart show HV at 1202
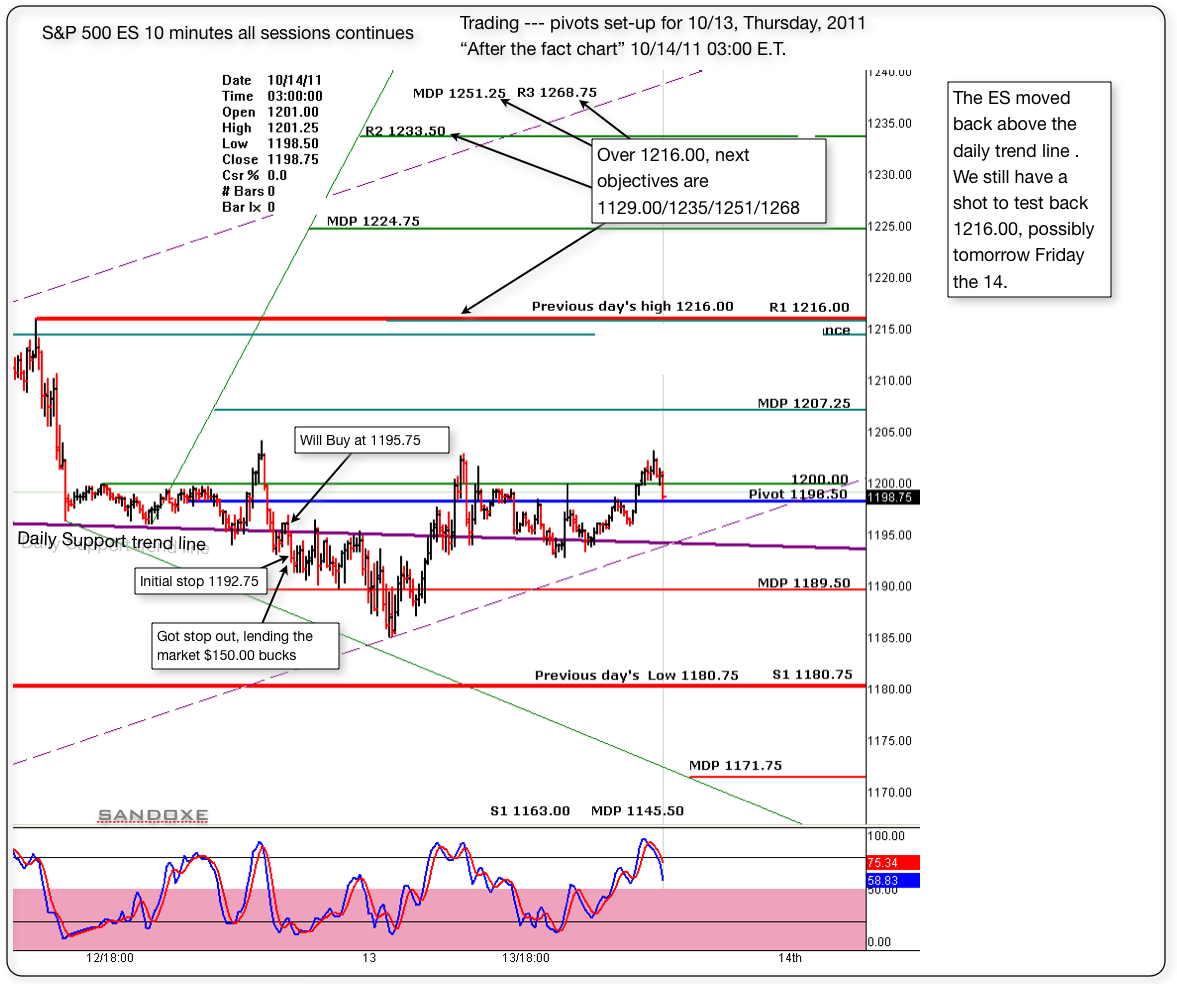
Below is the 10 minutes follow up chart or "after the fact chart" Today was not my day. After the first trade I knew it was best to stay away. Did one more trade and luckily got stop out at B.E. But, I still lend the market $150.00 for the day.
In trading, you will find, that, no matter what system you have, or how good of a trader you are, there will be days when you are not in the "zone" Those are days that it's better to close shop and go play.......
In trading, you will find, that, no matter what system you have, or how good of a trader you are, there will be days when you are not in the "zone" Those are days that it's better to close shop and go play.......
Click image for original size
Originally posted by sandoxe
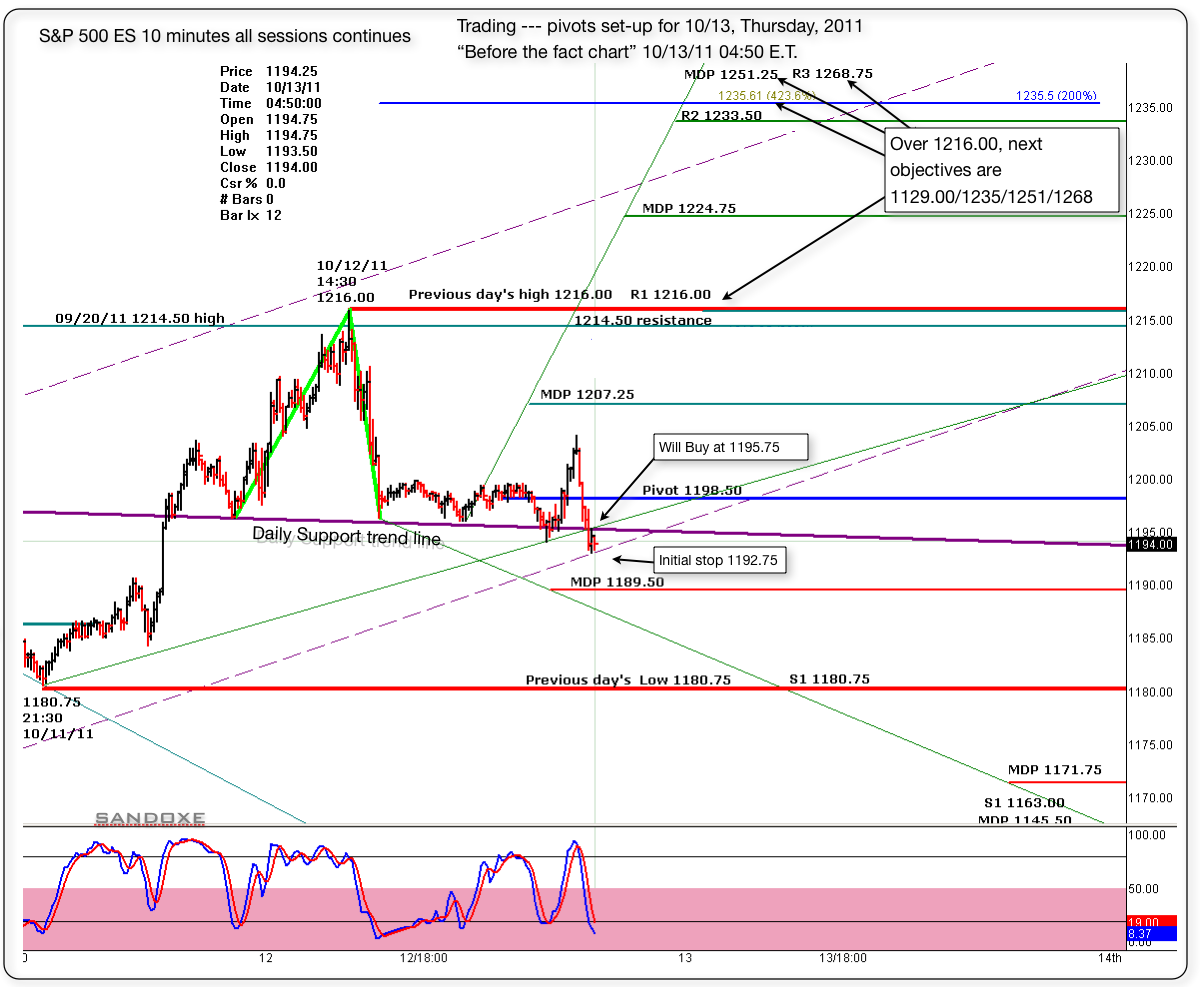
If the bulls still want to give it one more test to 1216, and possibly 1229 with good spike after that I'm Ok with it. Maybe today and tomorrow.
Below is the "before the fact chart" with the pivots set up for today. I'm buying at 1195.75, just above the daily trend line.
Initial stop at 1192.75.
Will see what the market has for us, and as always, the market has the last word and in due time will show us the way.
I see for you the same I see for my self: Having the best of luck and fun, awesome profitable trading day!
Click image for original size
Emini Day Trading /
Daily Notes /
Forecast /
Economic Events /
Search /
Terms and Conditions /
Disclaimer /
Books /
Online Books /
Site Map /
Contact /
Privacy Policy /
Links /
About /
Day Trading Forum /
Investment Calculators /
Pivot Point Calculator /
Market Profile Generator /
Fibonacci Calculator /
Mailing List /
Advertise Here /
Articles /
Financial Terms /
Brokers /
Software /
Holidays /
Stock Split Calendar /
Mortgage Calculator /
Donate
Copyright © 2004-2023, MyPivots. All rights reserved.
Copyright © 2004-2023, MyPivots. All rights reserved.