ES Thursday 10-13-11
I know many are getting new charts and becoming familiar with volume profiles. Here is the last two days for reference with the appropriate high and low volume marked off. This way those who are new can compare their charts to this one. Lots of good bell curves to work with once the 8:30 reports come out
Click image for original size
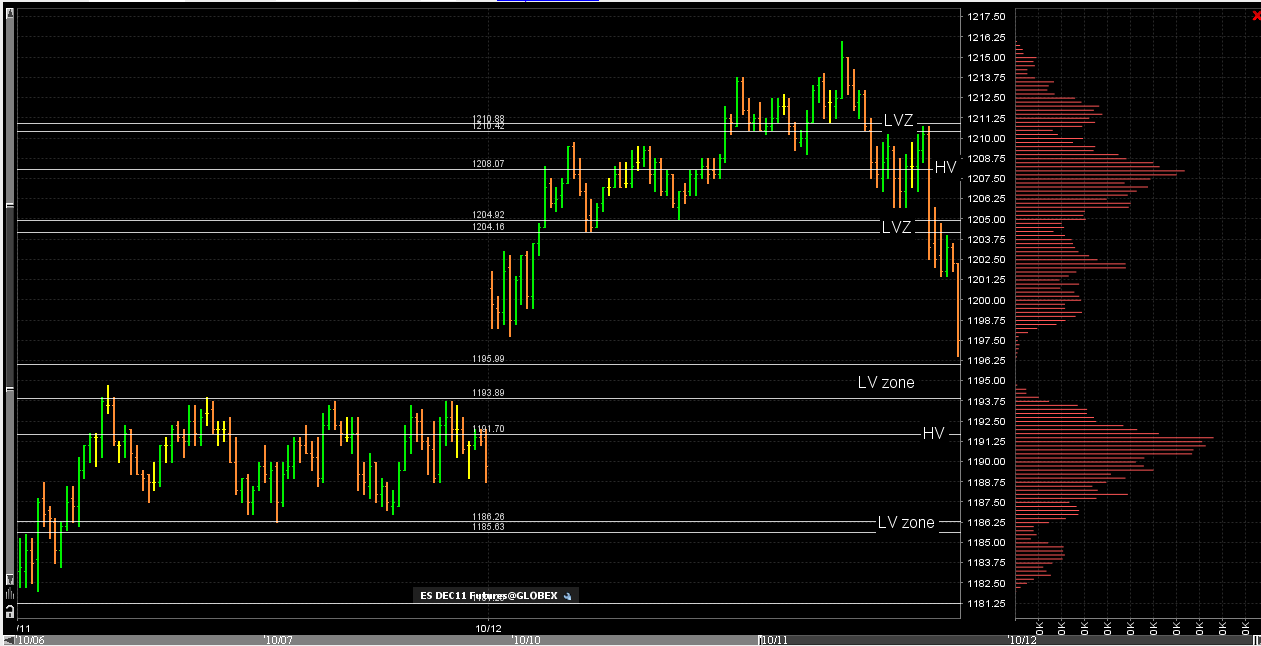
cool..see how the 93.75 ..lower edge of upper bell curve held so trying to sell new highs would have been much higher risk...getting back down into the 96 area is the one thing that would have me thinking about shorts again and put me on the lookout...otherwise I'd let this rally run but may hunt up above 1102.50 and especially near yesterdays low volume or 1204 for shorts once again
i see the edge of 93.75 and the edge of 96.79 so shorts up here at LV 1204 are not really out of the qwestion
Originally posted by della
lisa chart show HV at 1202
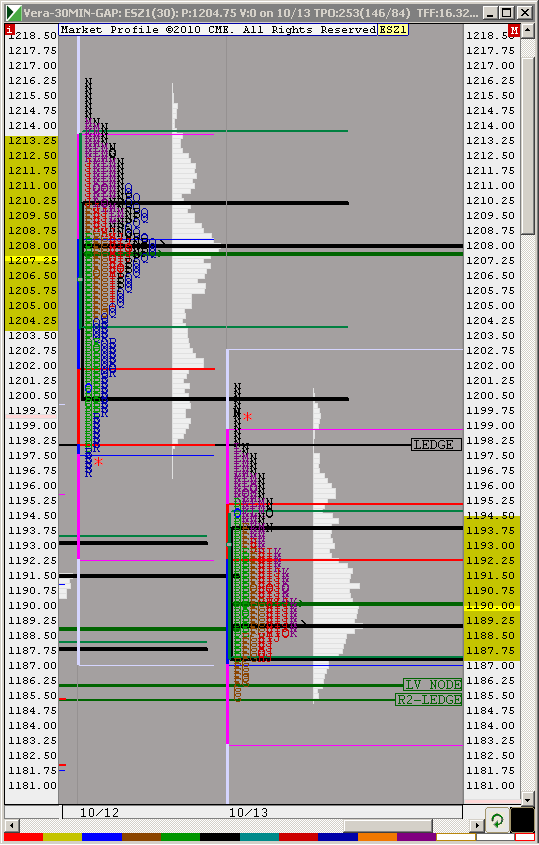
Della, here is a better caption. Black lines are volume LVA, POC and HVA - see white areas of the chart
Click image for original size
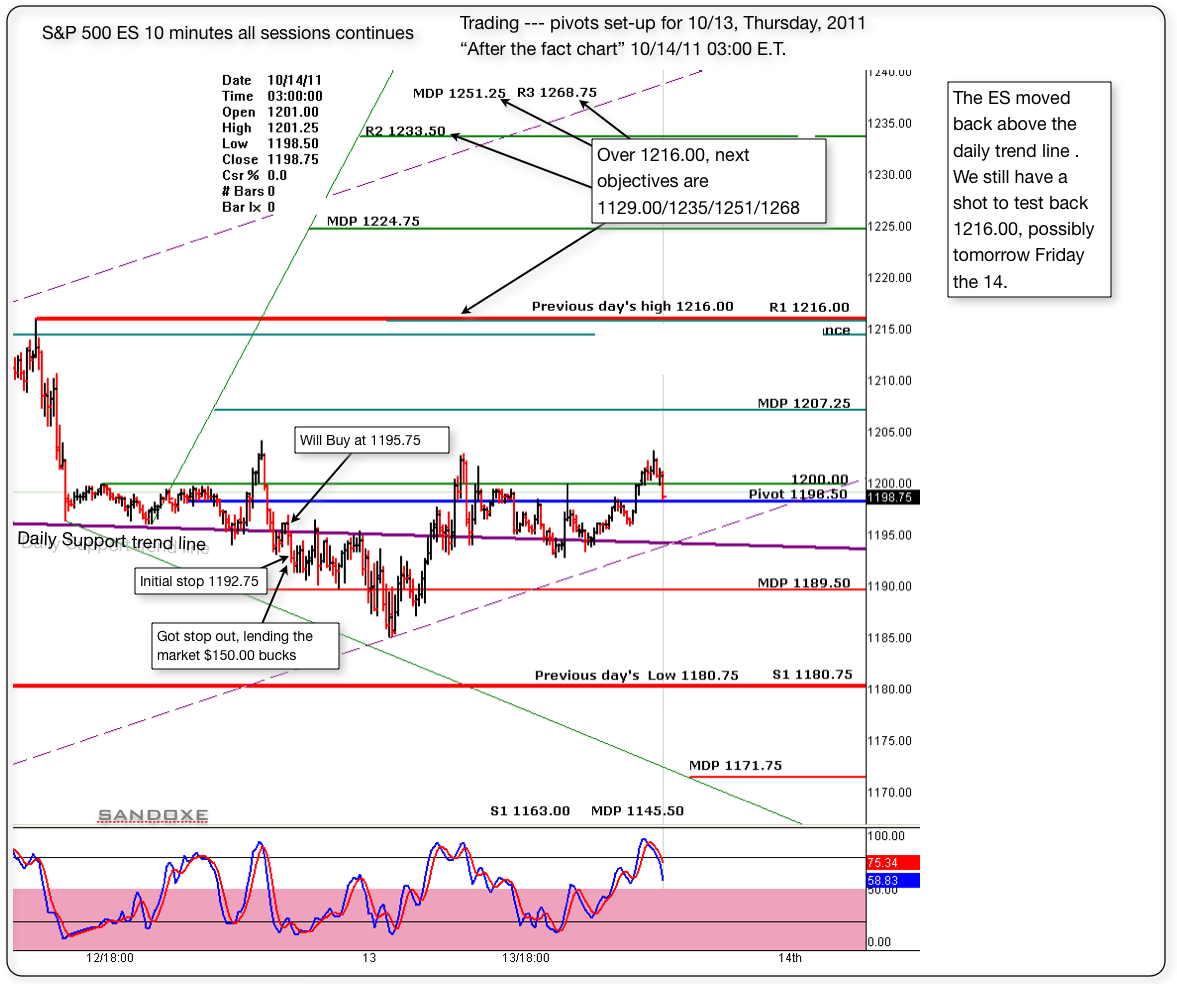
I gave it an other shot above the support trend line same price 1195.75 I'm at B.E. and will seat here till it gives me 1216 LOL
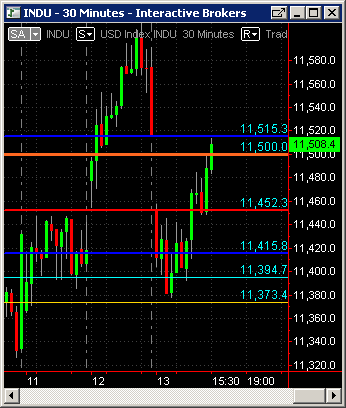
INDU closed its gap here
coming out of bollerger band up here
Click image for original size
today I AM "tradzilla" (no offence, man). I cannot believe how many posts I have today. Sorry guys.
lias seee what i mean about bollerger band
Della, no. Can you post a chart?
Below is the 10 minutes follow up chart or "after the fact chart" Today was not my day. After the first trade I knew it was best to stay away. Did one more trade and luckily got stop out at B.E. But, I still lend the market $150.00 for the day.
In trading, you will find, that, no matter what system you have, or how good of a trader you are, there will be days when you are not in the "zone" Those are days that it's better to close shop and go play.......
In trading, you will find, that, no matter what system you have, or how good of a trader you are, there will be days when you are not in the "zone" Those are days that it's better to close shop and go play.......
Click image for original size
Originally posted by sandoxe
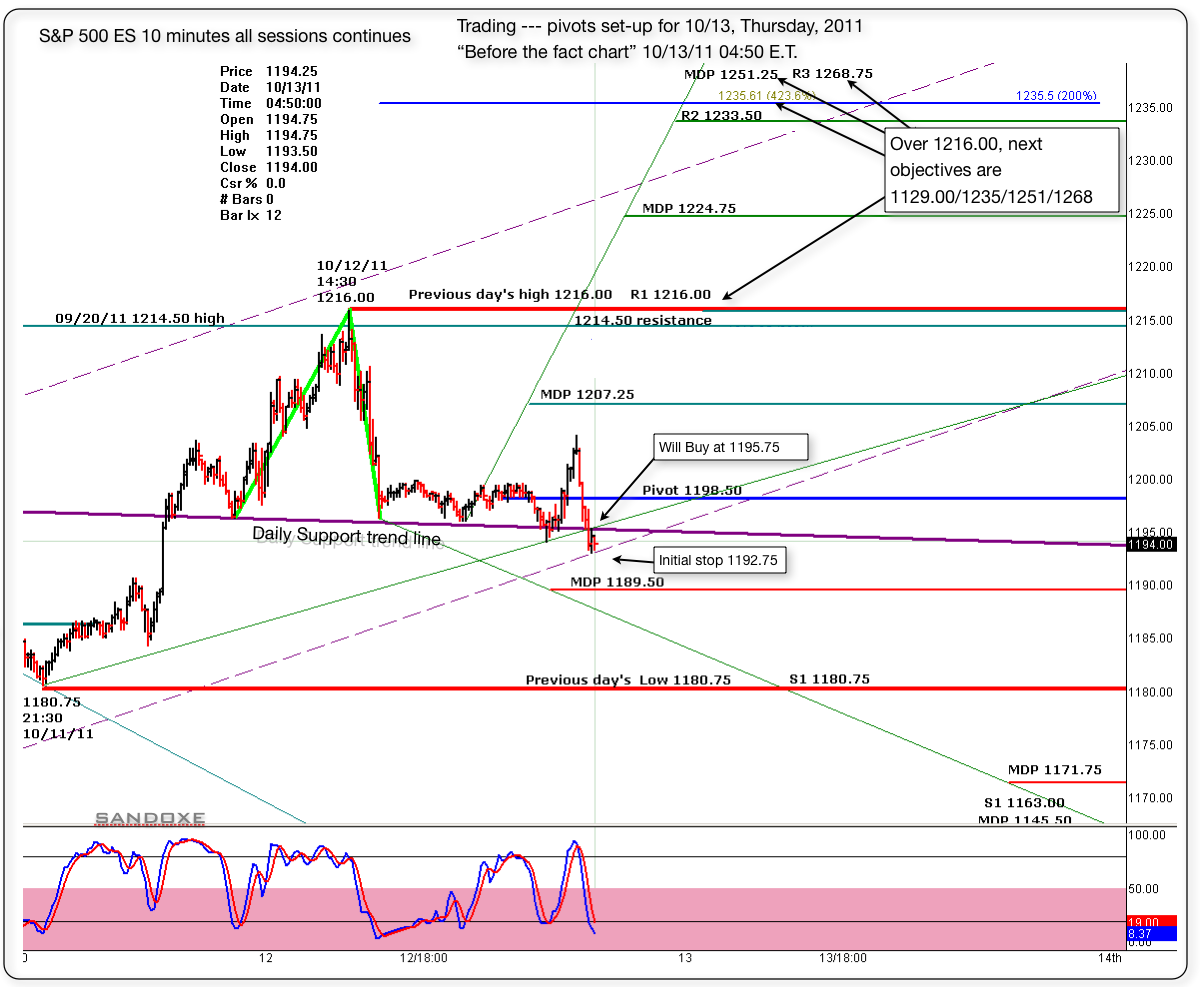
If the bulls still want to give it one more test to 1216, and possibly 1229 with good spike after that I'm Ok with it. Maybe today and tomorrow.
Below is the "before the fact chart" with the pivots set up for today. I'm buying at 1195.75, just above the daily trend line.
Initial stop at 1192.75.
Will see what the market has for us, and as always, the market has the last word and in due time will show us the way.
I see for you the same I see for my self: Having the best of luck and fun, awesome profitable trading day!
Click image for original size
Emini Day Trading /
Daily Notes /
Forecast /
Economic Events /
Search /
Terms and Conditions /
Disclaimer /
Books /
Online Books /
Site Map /
Contact /
Privacy Policy /
Links /
About /
Day Trading Forum /
Investment Calculators /
Pivot Point Calculator /
Market Profile Generator /
Fibonacci Calculator /
Mailing List /
Advertise Here /
Articles /
Financial Terms /
Brokers /
Software /
Holidays /
Stock Split Calendar /
Mortgage Calculator /
Donate
Copyright © 2004-2023, MyPivots. All rights reserved.
Copyright © 2004-2023, MyPivots. All rights reserved.