ES Monday 10-17-11
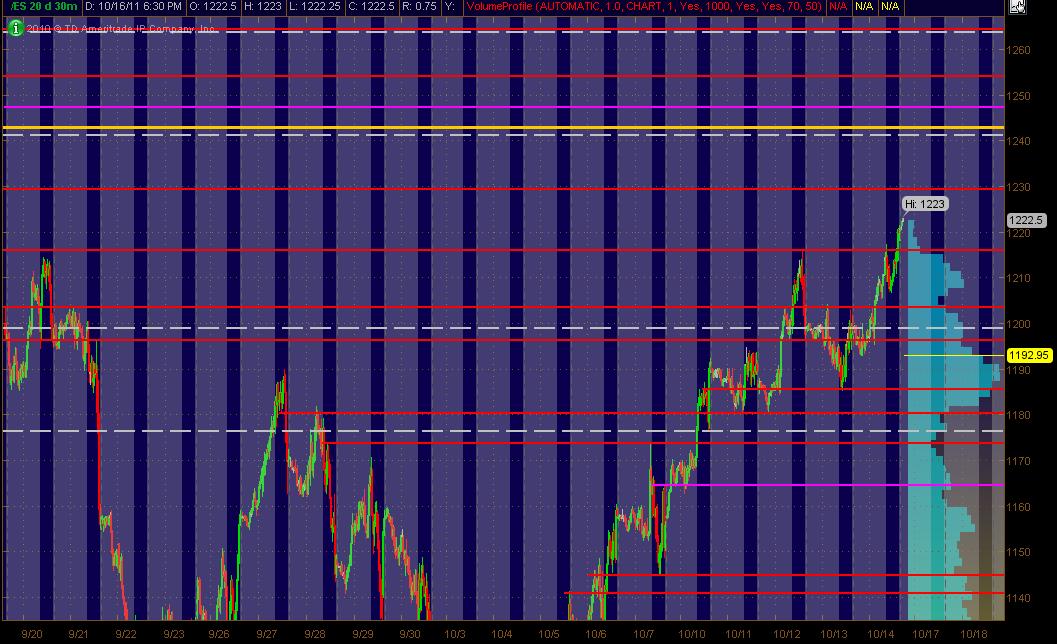
Here's what I've got in the way of a MAP for the ES coming into Monday's trading and the week. The Red Lines are potential significant PASR levels with any Magenta Lines as "semi" significant levels. White Dashed Lines are Wkly Pivots as per mypivots site. The Yellow line above the current market is a significant Fib Cluster fwiw.
The right vertical lighter Blue reflects 20 days of All Trading Hours Volume Profile. The Grayed out background is the non-RTH price activity. Hope this his helpful for some ... especially when incorporated with shorter term Volume Profile of the past 1 to several days ... looking at bell curves and more importantly, the High Volume Areas ... and the Low Volume Areas.
The right vertical lighter Blue reflects 20 days of All Trading Hours Volume Profile. The Grayed out background is the non-RTH price activity. Hope this his helpful for some ... especially when incorporated with shorter term Volume Profile of the past 1 to several days ... looking at bell curves and more importantly, the High Volume Areas ... and the Low Volume Areas.
Click image for original size
Good point Paul....lots of volume in our way on Friday so if we cannot stay out of 17.75 low volume then we run the risk of consolidating inside Fridays range or chop around to digest all that volume. Hence my reluctance to buy in high volume areas.
The best shot at a long fade will probably be down near the 1204 - 1205 that is a low volume node from the other day that Lorn mentioned.
Good luck at the dentist.
The best shot at a long fade will probably be down near the 1204 - 1205 that is a low volume node from the other day that Lorn mentioned.
Good luck at the dentist.
Originally posted by PAUL9
BTW, Lorn.
none of your comments had been published when I tagged the reply to the thread button and started writing.
I am so happy that I have something to look forward to today. A dentist appointment at 1pm. I will ask for no novacaine. it will be a blessing compared to trying to make sense out of this mess.
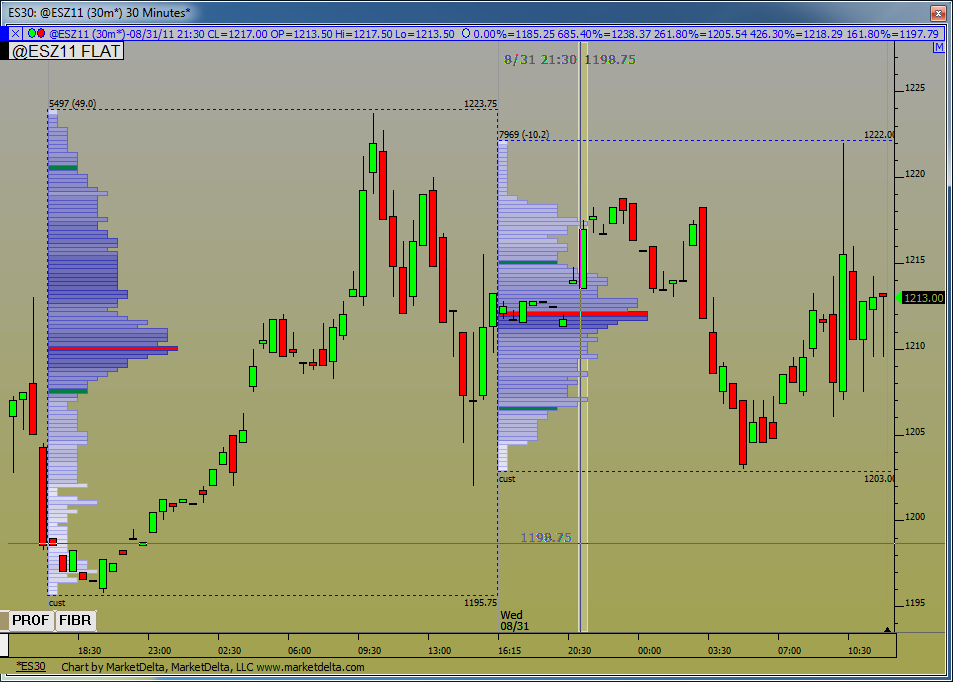
Here you go Bruce. Volume is definitely spotty back on these dates for the dec. contract.
Click image for original size
Click image for original size

edge from fri 13.00 act as surpport here
was also edge from wed
Incidentally, projection down off the O/N top using 60min time frame gives 4.236 right into 1206.75.....
Thanks Lorn...this is one of the main challenges with Volume profile..what to do to get volume when the current contract has no volume at those prices.??.. you can also see the consolidation that began just above the 1230....we don't want to think the volume is magical and still should always see what is happening on a 5 minute or lower bar chart to see where breakout points ( low volume) began....
we know we always get low volume above and below the high volume bell curves...
After awhile finding the areas to trade becomes real simple and the majority of our time should be spent getting better at trade execution skills and trade management...
we know we always get low volume above and below the high volume bell curves...
After awhile finding the areas to trade becomes real simple and the majority of our time should be spent getting better at trade execution skills and trade management...
my plan is to buy down here...below the 13.75 in RTH....sells will come near 17.75 if at all
Originally posted by Lorn
Incidentally, projection down off the O/N top using 60min time frame gives 4.236 right into 1206.75.....
TY Lorn. Doing a KT projection from the 1130.75-1123 move gave an initial projection of 1218.25 that didn't do much for us and a full projection of 1210.5 that has played so far.
Originally posted by PAUL9
BTW, Lorn.
I am so happy that I have something to look forward to today. A dentist appointment at 1pm. I will ask for no novacaine. it will be a blessing compared to trying to make sense out of this mess.
You can ask for a "laughing gas". The only legal way to get high...lol
Just make sure the dentist doesn't take it, he might pull the wrong tooth!
Originally posted by Lisa P
Originally posted by PAUL9
BTW, Lorn.
I am so happy that I have something to look forward to today. A dentist appointment at 1pm. I will ask for no novacaine. it will be a blessing compared to trying to make sense out of this mess.
You can ask for a "laughing gas". The only legal way to get high...lol
it really cool that when we come back down or go up you can go to that day on the forum and look back a see what was going on that day
Emini Day Trading /
Daily Notes /
Forecast /
Economic Events /
Search /
Terms and Conditions /
Disclaimer /
Books /
Online Books /
Site Map /
Contact /
Privacy Policy /
Links /
About /
Day Trading Forum /
Investment Calculators /
Pivot Point Calculator /
Market Profile Generator /
Fibonacci Calculator /
Mailing List /
Advertise Here /
Articles /
Financial Terms /
Brokers /
Software /
Holidays /
Stock Split Calendar /
Mortgage Calculator /
Donate
Copyright © 2004-2023, MyPivots. All rights reserved.
Copyright © 2004-2023, MyPivots. All rights reserved.