ES Monday 10-17-11
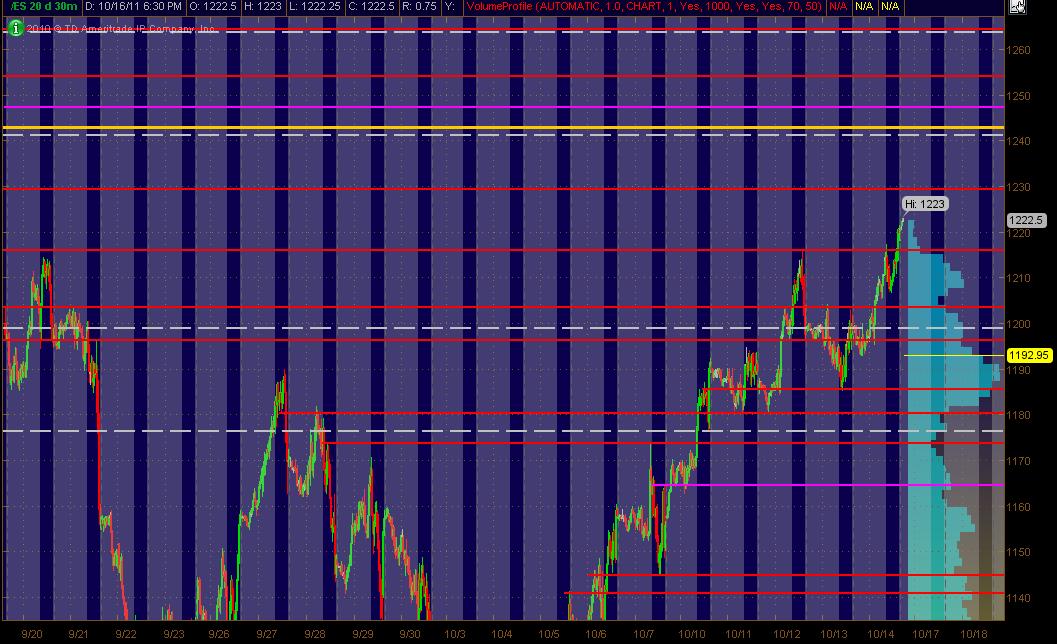
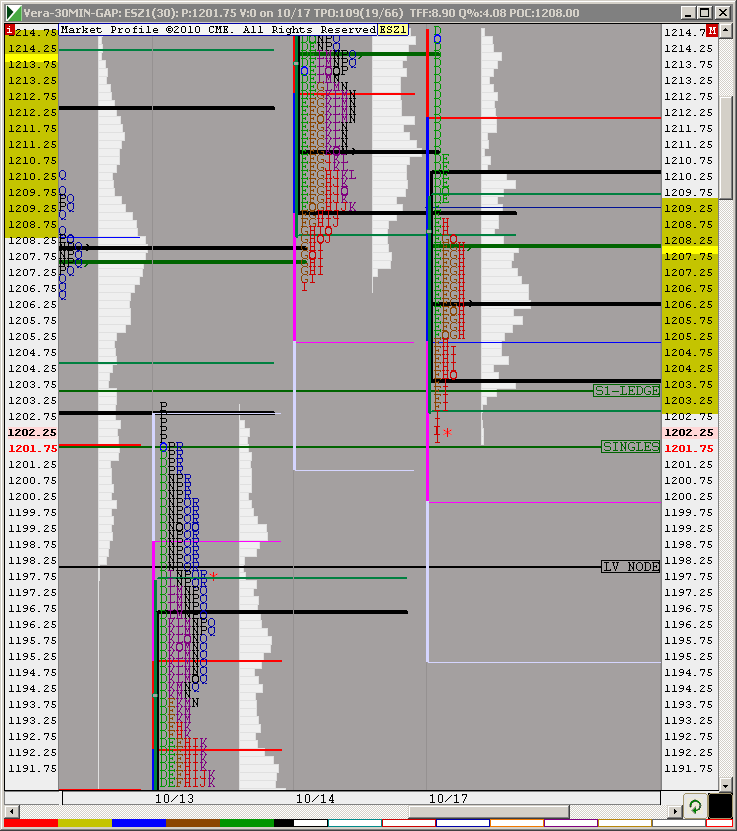
Here's what I've got in the way of a MAP for the ES coming into Monday's trading and the week. The Red Lines are potential significant PASR levels with any Magenta Lines as "semi" significant levels. White Dashed Lines are Wkly Pivots as per mypivots site. The Yellow line above the current market is a significant Fib Cluster fwiw.
The right vertical lighter Blue reflects 20 days of All Trading Hours Volume Profile. The Grayed out background is the non-RTH price activity. Hope this his helpful for some ... especially when incorporated with shorter term Volume Profile of the past 1 to several days ... looking at bell curves and more importantly, the High Volume Areas ... and the Low Volume Areas.
The right vertical lighter Blue reflects 20 days of All Trading Hours Volume Profile. The Grayed out background is the non-RTH price activity. Hope this his helpful for some ... especially when incorporated with shorter term Volume Profile of the past 1 to several days ... looking at bell curves and more importantly, the High Volume Areas ... and the Low Volume Areas.
Click image for original size
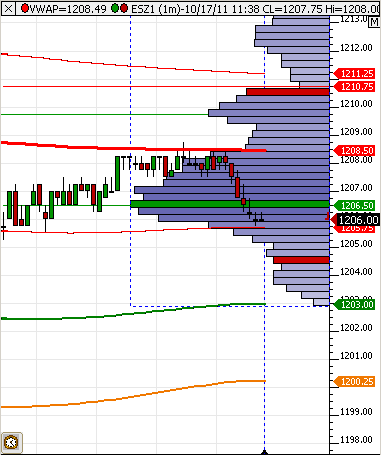
just flipped down to 6.25 price needs to hold above that now....getting new lows after a flip down would not be a fade long that you want to take as price ias attracting volume at lower prices than friday
Originally posted by BruceM
Lisa...i am not getting the point across if u needed to ask that......
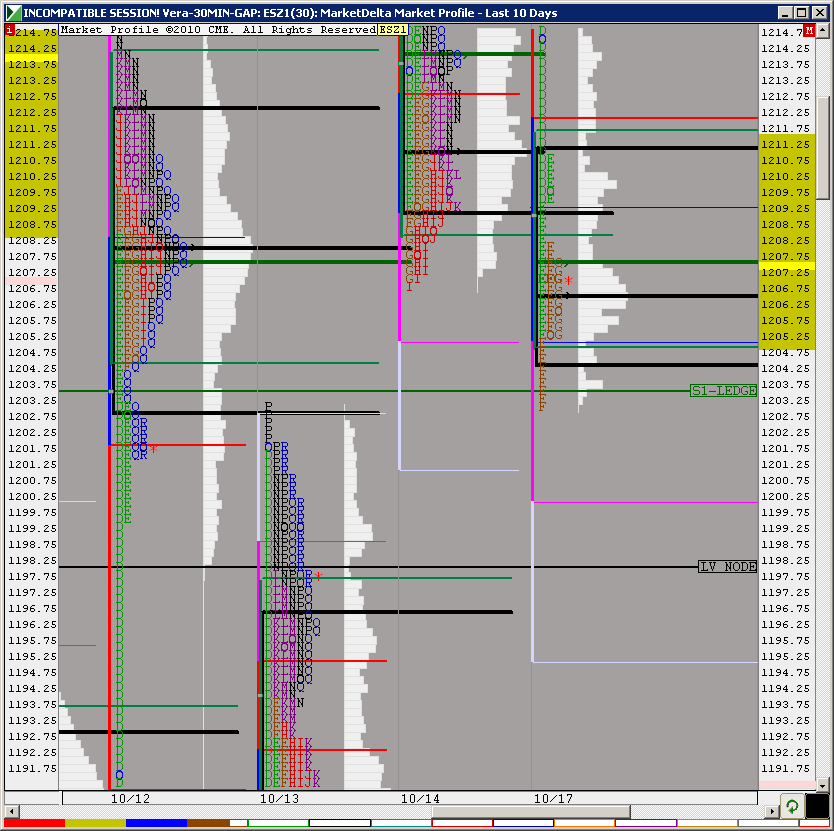
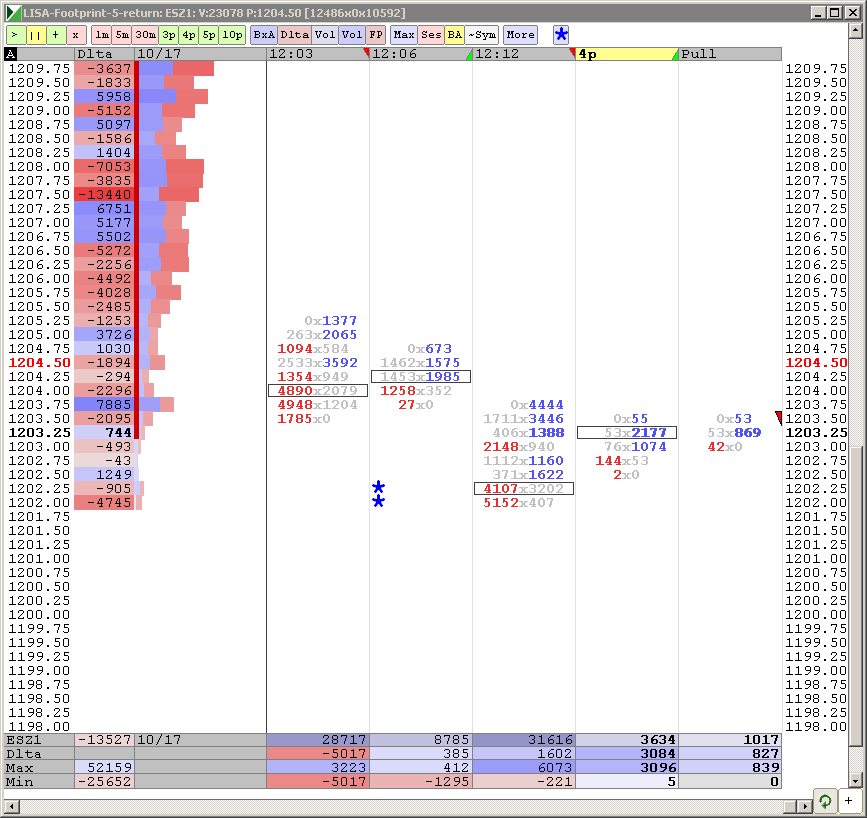
Sorry Bruce, I just got confused by your reference to Lorn. I am long too, from retest of that large footprint. I have LV node (as target 1) at 08.25 and TPO singles (target 2)to 09.25.
Click image for original size
took one at 07.....volume is dismal now..holding one to see if they can test that 08.50.....all harder holds as we have the flip lower vpoc and all volume is below the key volume from fridays trade
hope u feel better della...get some rest
hope u feel better della...get some rest
I was just teasing him.....as I often do....just went flat on this push into target
by monitoring the developing high volume node and comparing it to recent days you can "see" if value is being created higher or lower....this is basically the same thing as monitoring the value area in relation to other days...withoutthe val high or low...
Biggest question now is what happens when we are sandwhich between developing poc like the 06.25 and fridays at the 11 area ?
the best fades would come up near the 1210 - 1211 area but we may not even get a chance...bias would need to be short as long as we stay below Fridays POC..and build up time and price below there....we are creating a BELL curve at lower levels.....so far...as usual developing volume is harder to trade ...too much informatio!!
nice trade Lisa!!
You all should know Bruce gets easily confused by whatever I say. ;-)
SIngles down to 1201.75
Click image for original size
Volume in that area
Click image for original size
it really cool that when we come back down or go up you can go to that day on the forum and look back a see what was going on that day
Emini Day Trading /
Daily Notes /
Forecast /
Economic Events /
Search /
Terms and Conditions /
Disclaimer /
Books /
Online Books /
Site Map /
Contact /
Privacy Policy /
Links /
About /
Day Trading Forum /
Investment Calculators /
Pivot Point Calculator /
Market Profile Generator /
Fibonacci Calculator /
Mailing List /
Advertise Here /
Articles /
Financial Terms /
Brokers /
Software /
Holidays /
Stock Split Calendar /
Mortgage Calculator /
Donate
Copyright © 2004-2023, MyPivots. All rights reserved.
Copyright © 2004-2023, MyPivots. All rights reserved.