ES Monday 10-17-11
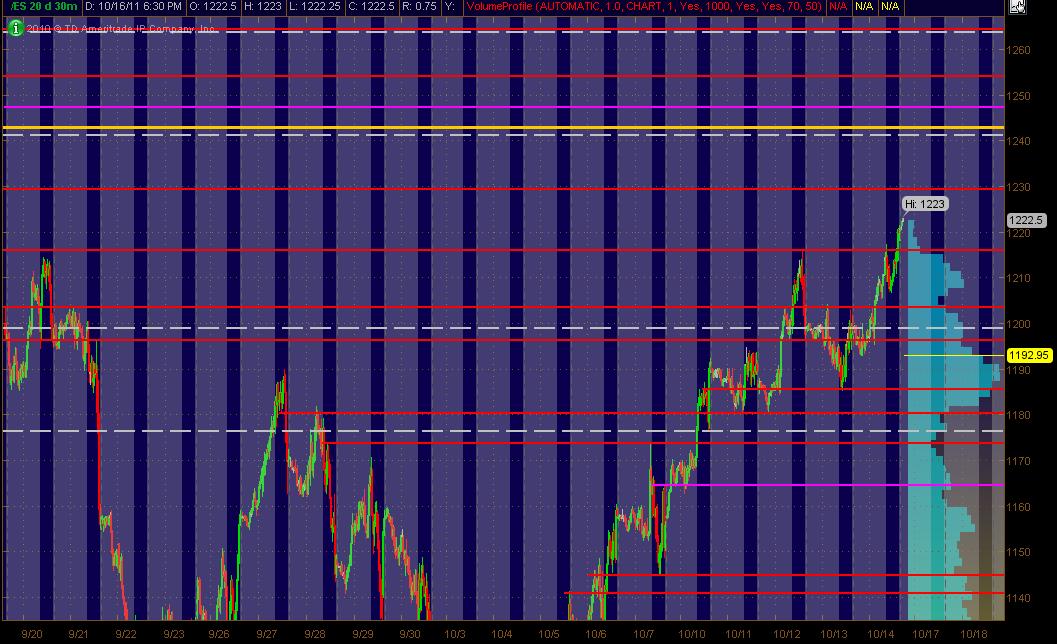
Here's what I've got in the way of a MAP for the ES coming into Monday's trading and the week. The Red Lines are potential significant PASR levels with any Magenta Lines as "semi" significant levels. White Dashed Lines are Wkly Pivots as per mypivots site. The Yellow line above the current market is a significant Fib Cluster fwiw.
The right vertical lighter Blue reflects 20 days of All Trading Hours Volume Profile. The Grayed out background is the non-RTH price activity. Hope this his helpful for some ... especially when incorporated with shorter term Volume Profile of the past 1 to several days ... looking at bell curves and more importantly, the High Volume Areas ... and the Low Volume Areas.
The right vertical lighter Blue reflects 20 days of All Trading Hours Volume Profile. The Grayed out background is the non-RTH price activity. Hope this his helpful for some ... especially when incorporated with shorter term Volume Profile of the past 1 to several days ... looking at bell curves and more importantly, the High Volume Areas ... and the Low Volume Areas.
Click image for original size
Sorry for too many posts. Going to curb before I turn into Tradezilla.
BTW, singles on NQ also taken. Nough posts.
97.75 and 95.50 are the nearest buy zones on my radar...
gap from OCt 13
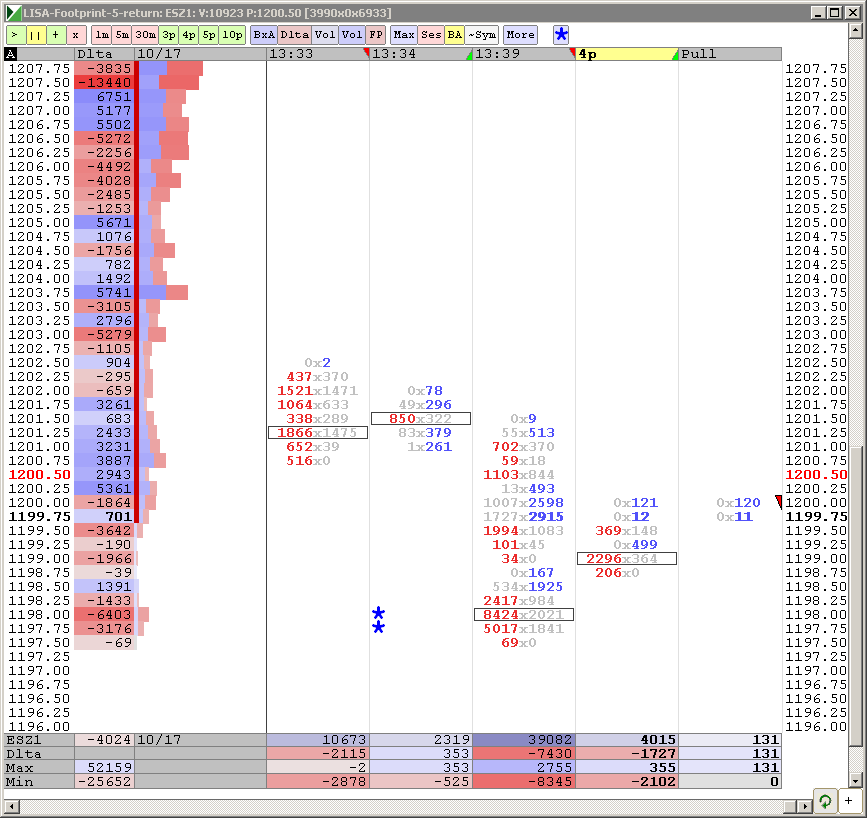
We retrace a bit. now looking for support at 1192/95 area. possibly there by 13:30 +- or so. Very important that holds here. Why? bc it's that old support trend line we talked about last week. If does not hold.....where's my bear hut?......hmmmmm
ES now trading 1199.00 13:38
ES now trading 1199.00 13:38
Originally posted by sandoxe
Keeps probing that 1229 75 resistance. May need to back off a bit and try it again. Overcoming 1229.75 will give us 1234.00. possibly 1247. tomorrow.
Will see how we do here first at 1229.75.
ES now trading 1229.25 04:01 E.T.
Originally posted by sandoxe
Keeps going like this, it will most likely hits 1234 early morning 3:30/4:00 AMOriginally posted by sandoxe
Some congruency with 1229.00. The price needs to move over that if possible tonight. Jump it! The next resistance areas are at 1234, 1244, 1251.
People have 1215 and I have 1216/1214.50 -- looks like that area is very import!!
As always, the market has the last word and in due time will show us the way!
I see for you the same I see for my self: Having the best of luck, fun, and awesome profitable trading day!!!
here's how that zone is looking in my world.....need to get beyond 1202.50 and 1205.25 but feel we may need to take muliple shots at longs down here ..this selloff is all happening a bit early today in general...all second level single prints have been filled so far...only originals remain "open"
Click image for original size
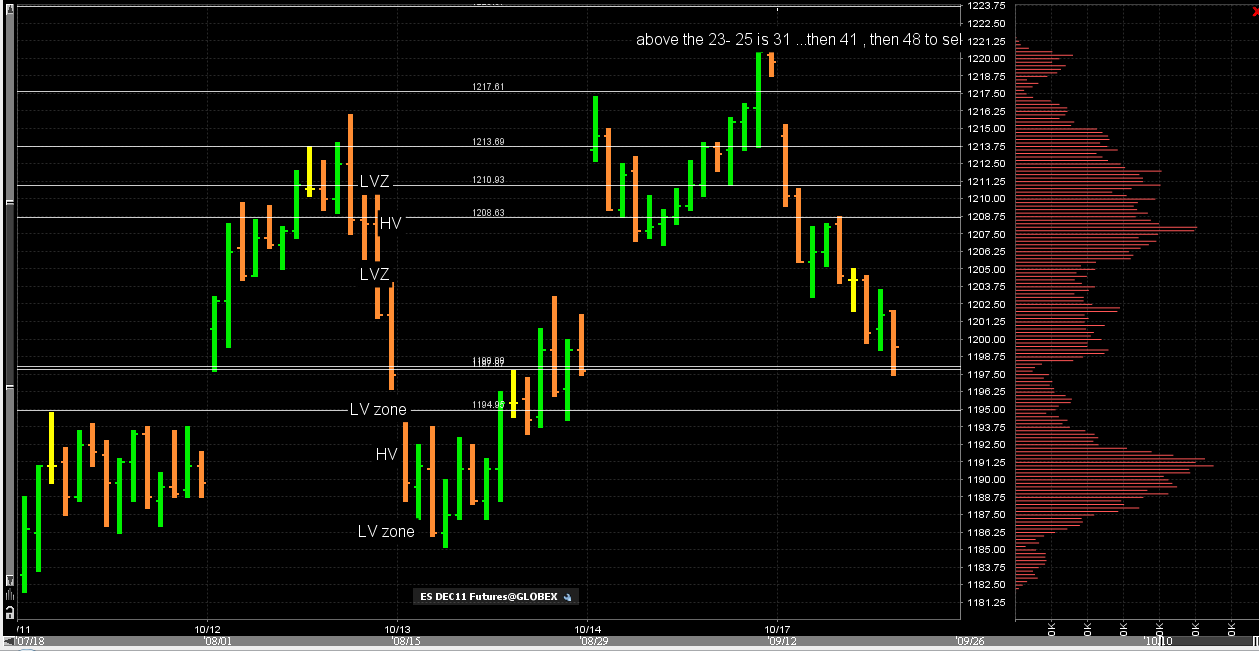
Bruce, it this 3-day combined chart?
I just posted that quick Lisa...it is actually a weeks worth but you should really be looking at only last thursday for the BEST areas
it really cool that when we come back down or go up you can go to that day on the forum and look back a see what was going on that day
Emini Day Trading /
Daily Notes /
Forecast /
Economic Events /
Search /
Terms and Conditions /
Disclaimer /
Books /
Online Books /
Site Map /
Contact /
Privacy Policy /
Links /
About /
Day Trading Forum /
Investment Calculators /
Pivot Point Calculator /
Market Profile Generator /
Fibonacci Calculator /
Mailing List /
Advertise Here /
Articles /
Financial Terms /
Brokers /
Software /
Holidays /
Stock Split Calendar /
Mortgage Calculator /
Donate
Copyright © 2004-2023, MyPivots. All rights reserved.
Copyright © 2004-2023, MyPivots. All rights reserved.