ES WED 10/19/2011
BruceM | 18-Oct-2011 at 4:06 PM | Rep: 47.8k | Posts: 10.6k | mail
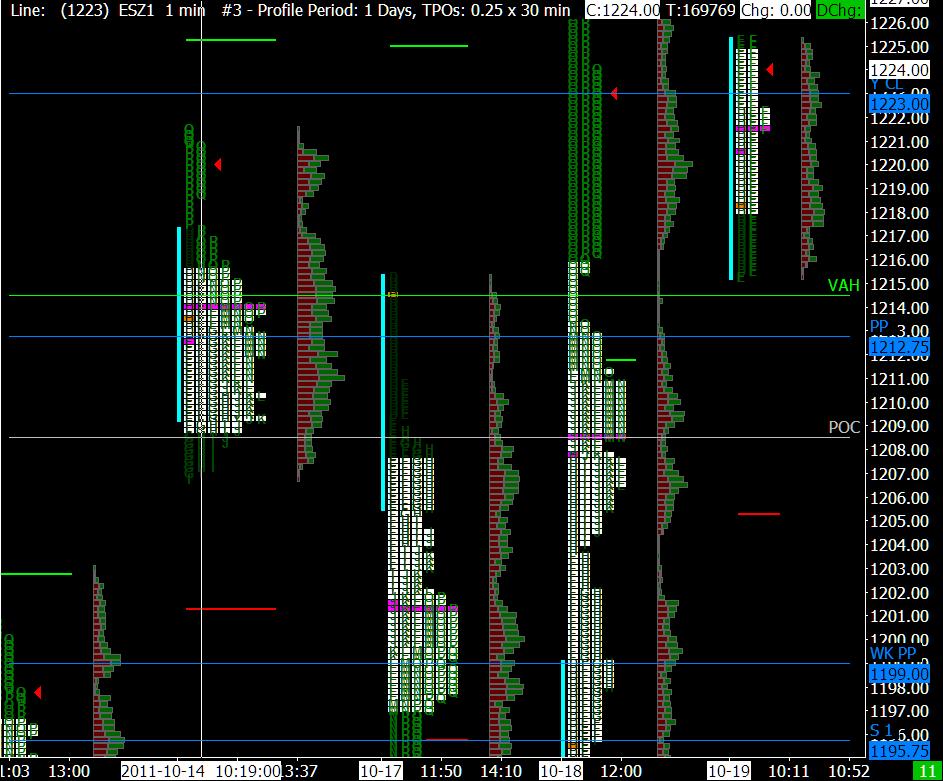
I'm burned out from forum life...LOL....but I'll leave you with this today.....we had the 23.75 area marked as a long term Auction high from yesterdays thread. We also had the last low volume area from yesterday thread marked at 1217.
That news event spike blew through the 1217 without a retest at first . Some may have been thinking that my volume idea was going to fail and the 1217 was going to be passed on by. I was thinking that myself. Once we started to get back under the 23.75 long term bracket then you owed it to yourself to start thinking about the 1217 again...
main numbers as I type going into tomorrows trade will be
93.75 - 95
1202 - 1204
1207 - 1208
and 1213.75 - 1215.25 but I'm not sure that this won't be filled in before we close...we'll see
good luck
Click image for original size
Wow didn't mean to attach it twice Lisa.
Originally posted by rburns
Ok took the clasic Bruce hour runnout
rburns could you please give a brief description of Bruce's hour runout?
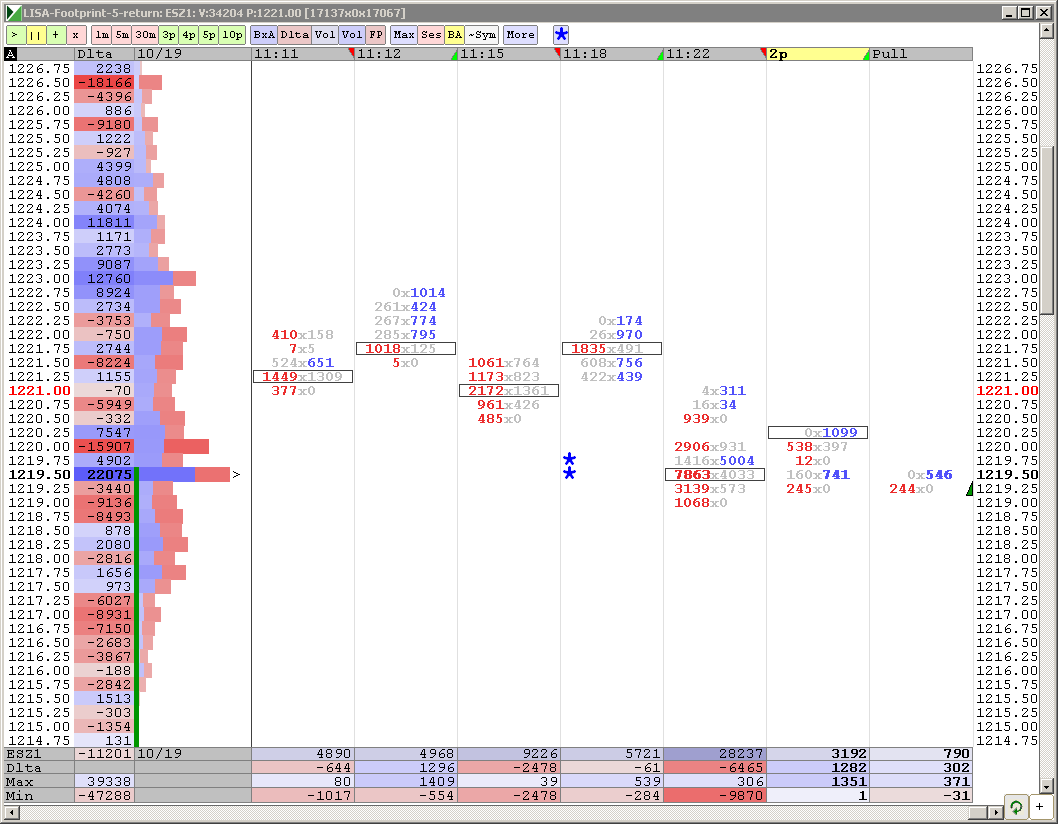
Thanks Loved. Here is my M-Delta beforelast bouce. Volume pathetic - best not to trade now.
Click image for original size
This is sooo bearish is pathetic. The bulls can keep trowing money at it, but soon or latter it needs to back off at list 100 hundles, maybe go down to or near 1068 and back up. Other than that......need strong numbers from the economy and global and bla, bla, bla needs many good bla, blas. I don't see that happening.
Will see, few more hiccups till they give up....tic, tic, tic
Will see, few more hiccups till they give up....tic, tic, tic
narrow range big time surporrt is 17. 15 .13.
The DJ index still needs to test 11716 high from 09/01/11, it has a Fib. 1.618 at 11729. -- Maybe in few hours will give it a shot. The ES could move back up again and try the 1229/1230.75 once again. Failure here? Use that top as a base to SELL!!! SELL!! SELL! At list back to the daily support trend line tested yesterday. Then use that as a base for the next trades.
But first lets see what happen at the S/R test 1230 ES 11729 DJ Index.
As always, the market has the last word and in due time will show us the way.
I see for you the same I see for my self: Having fun, and awesome, incredible profitable trading day and week!!!!
But first lets see what happen at the S/R test 1230 ES 11729 DJ Index.
As always, the market has the last word and in due time will show us the way.
I see for you the same I see for my self: Having fun, and awesome, incredible profitable trading day and week!!!!
I have 15,19,and 23.5 as operational fib levels here
Below 15 is 12,9,and 1206.5-break below and 1198.
Break upward and 1229.75 is the only level one will need as targets 1263 if it holds(can wiggle around it but might expect a quick retrace and run as in a spike , might not be today,if it gets back to it from here). 1234,39, and 49 above.
Below 15 is 12,9,and 1206.5-break below and 1198.
Break upward and 1229.75 is the only level one will need as targets 1263 if it holds(can wiggle around it but might expect a quick retrace and run as in a spike , might not be today,if it gets back to it from here). 1234,39, and 49 above.
when i see days like this on nas es I look at a indercator called ADX on the 5 min when it is in the over sold area tells me sooner or later to up side or down side there will be a brake then adx will move up its like a coil
Apologies
That should be 1230.75 above in previous post.
I think 1229.75 was YH.
That should be 1230.75 above in previous post.
I think 1229.75 was YH.
I exclusively use a 1-tick tick chart and try to capture 1 tick always using market orders for both entry and exit ... no stops - ever.
Emini Day Trading /
Daily Notes /
Forecast /
Economic Events /
Search /
Terms and Conditions /
Disclaimer /
Books /
Online Books /
Site Map /
Contact /
Privacy Policy /
Links /
About /
Day Trading Forum /
Investment Calculators /
Pivot Point Calculator /
Market Profile Generator /
Fibonacci Calculator /
Mailing List /
Advertise Here /
Articles /
Financial Terms /
Brokers /
Software /
Holidays /
Stock Split Calendar /
Mortgage Calculator /
Donate
Copyright © 2004-2023, MyPivots. All rights reserved.
Copyright © 2004-2023, MyPivots. All rights reserved.