ES Trading for 11-1-11
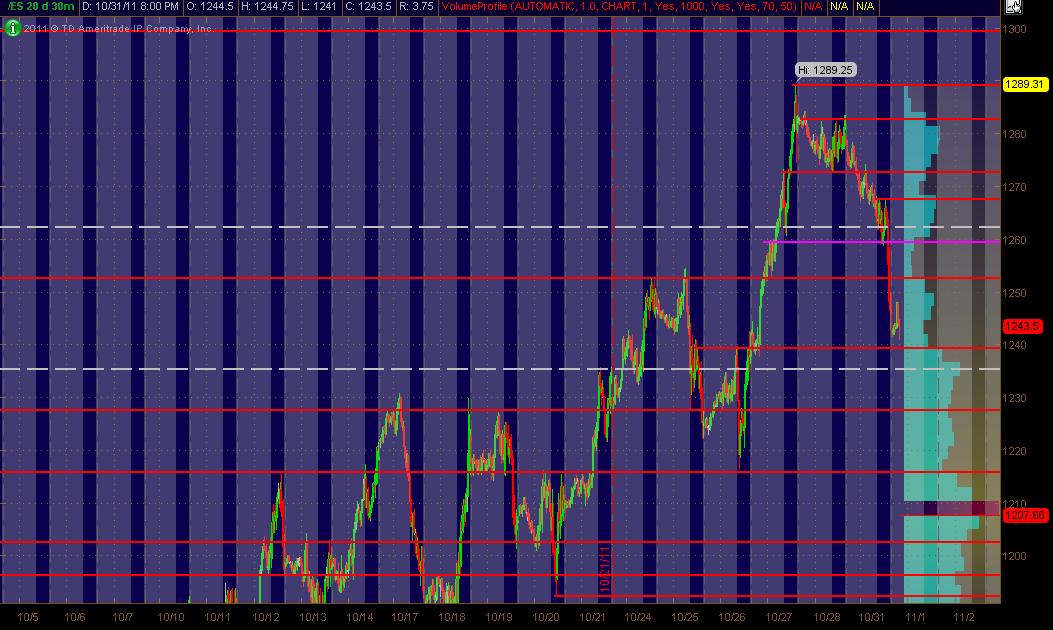
Here's what I've got as my revised MAP for Tuesday's trading ... 30min chart (20 days of data) of updated PASR levels/zones
Hope it's helpful to some!
Click image for original size
Hope it's helpful to some!
Am interested in seeing some other analysis/inputs ... especially with posted charts. Also, Volume Profile postings are great as they do the best job IMHO for describing price action going forward, especially as the day unfolds. So, hats off to Bruce, Lorn and others for input. Confluence can be a nice thing!
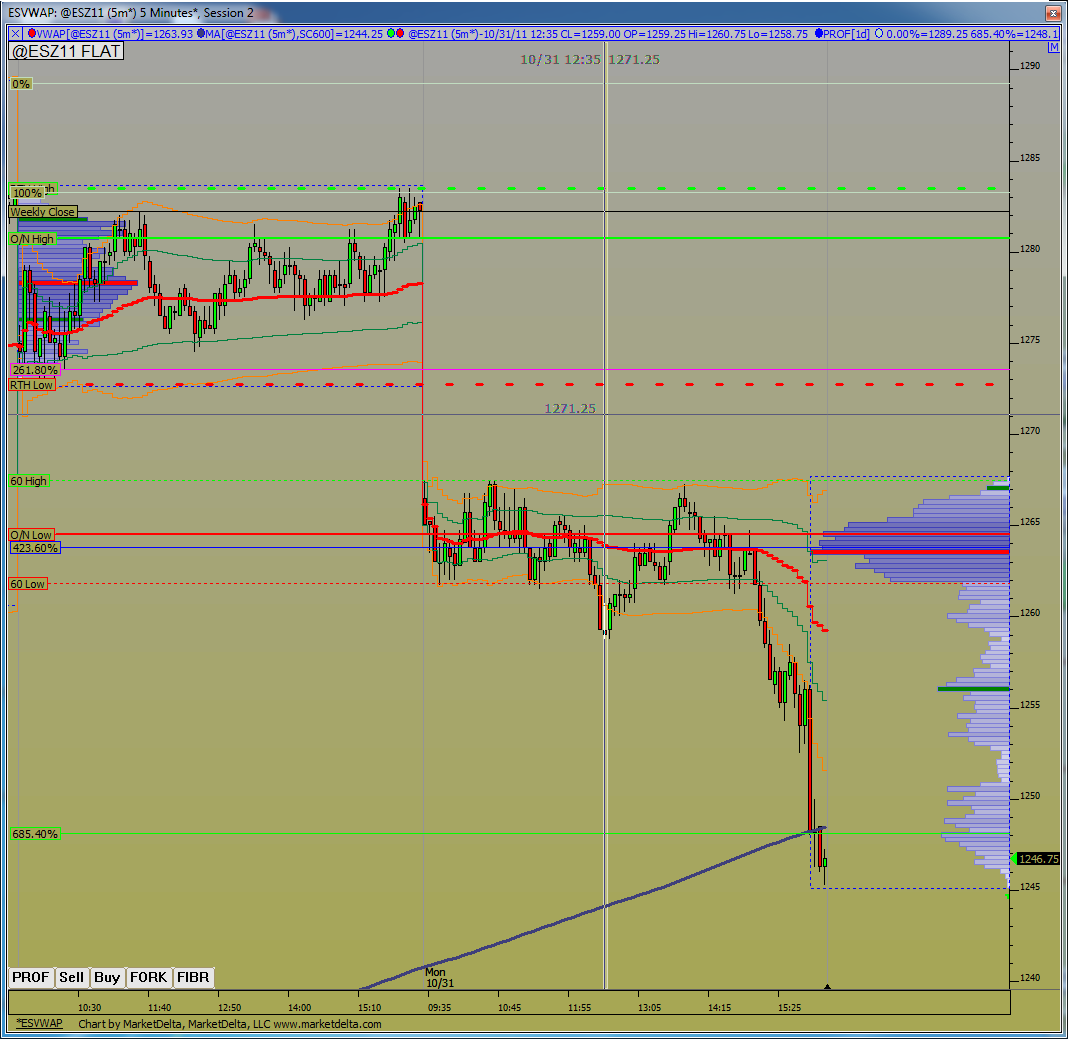
Here is a look at the action today. I haven't updated any of the daily lines so you can see how prices worked around the O/N low within the 60min range before breaking lower.
Rejected twice from the 60min high makes that LVN significant. Below that is the breakdown point of 1258.75 which also has a small rebound/retest after the breakdown to make that LVN significant.
1251-1253 is an obvious LVN, watch O/N action to see if this area is revisited and how...
The blue moving average prices finished at is the 5-min 600 period MA. I believe Paul has discussed this before on the forum, it behaves much like a 200 day moving average on a daily chart. Prices seem to be oscillating around this MA the last month. It trades to it, either from above or from below, trades around it for a day or day and a half, before moving away from it with fierce intensity...
Click image for original size
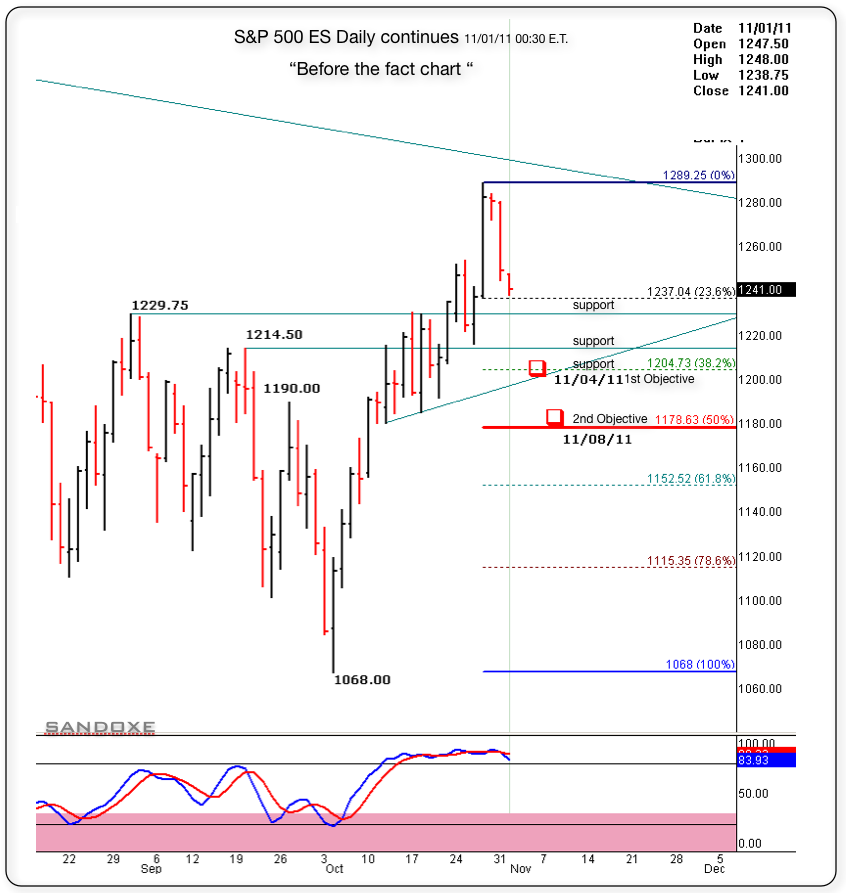
Below is the same daily chart posted last Thursday. In the chart you will notice that I have used the Fibonacci retrace levels to divide the previous up swing. (78.6% is not part of Fib. but I always used it).
Notice that the same S/R levels that where resistance when the market was moving up, are now support. I have the levels there bc they create the base for intraday trading.
For now I have two objectives. One at 1204.75 or 38% retrace and the other at 1178.75 or 50% retrace. The price could hit the objectives at that date or before that.
You have two objectives. How the heck do you play that? There are many different ways to play it. The one I use most, is play to the first objective and see how the price reacts at that S/R. If starts moving towards the next objective and I have the right set-up, then I will enter again, go with the trend! !
Other times I will take partial at first objective and let the rest run. If the market has strong momo I will just move my trailing stop close to it, till stops me out or hits the second objective. -- When you are in the middle of the battle you'll know what to do.
ES now trading 1238.50 01:57
As always, the market has the last word and in due time will show us the way.
Right now, next hours, next days, next weeks, next months and next years to come, I see for you the same I see for my self: Having the very best of luck, fun, awesome, incredibly profitable trading experience!!
Click image for original size
Using Kool numbers on 30 min and 88% rule on a one day chart the number 1198.25 shows up.
Lorn you see back at 10/20 that 01.25 and 03.50 2 edges
There was some LV there that may act as surport
I'm sure there was news.
For only the second time I recall this year futures ramped ahead of the cash index when the 1238 level gapped up in O/N tading last week.
Then the baseline of the H&S pattern from the first half of the year at 1267 was exceeded. Yesterday, it broke back below and held as resistance. A retrace is all that's required as far as I know. Sometimes it's the simple things.
The only levels to note are 1250(62%), 1215(50% of yearly range),1223.75(top of the box), and 1282(38%). In between one can use fibs also.
ON new low,below 1216. Corrections can happen. So far they've been small and quick. Intraday action maybe? Maybe I'm wrong and a lift possible. Has to get back above 1223.75 and those fibs above if so.
Crashes occur when least expected. IPO's,fed meetings,end of month? Doesn't matter.
Until a lift develops, I'll be looking at those levels as Resistance to be broken and held as S, but thinking failure probable.
The 1204 area noted,the 50% level at about 1180.
Yes I'm defining the zone from 1200-1203.
Originally posted by della
Lorn you see back at 10/20 that 01.25 and 03.50 2 edges
Greece is going to put austerity measures to a vote with the people..hmmm..wonder how that will work out???
ISM mfg and Const. spending at top of hour
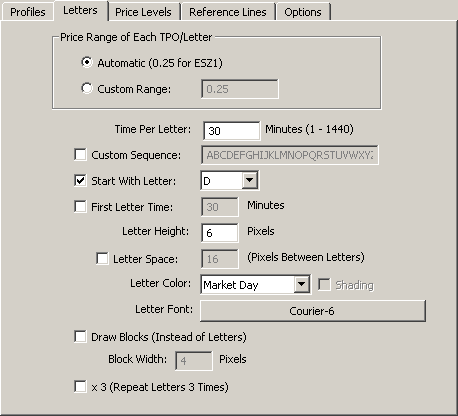
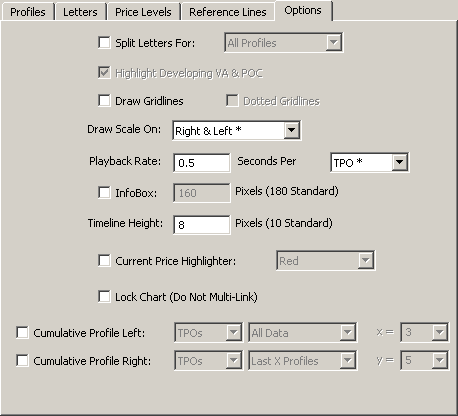
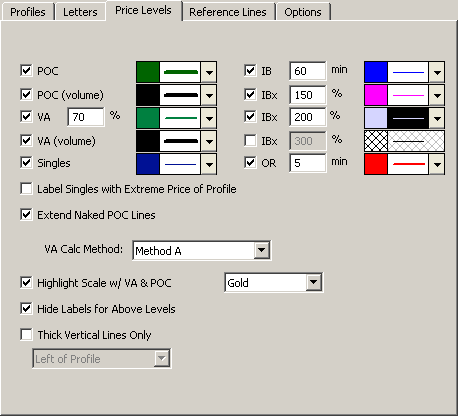
Enyamadi, here is My Profile chart settings in Market Delta. Open 30-min Profile chart. Right click on the chart, select Preferences. The following are the tabs, except Lines (which would be custom-created by you)
Click image for original size
Click image for original size
Click image for original size
Click image for original size

Emini Day Trading /
Daily Notes /
Forecast /
Economic Events /
Search /
Terms and Conditions /
Disclaimer /
Books /
Online Books /
Site Map /
Contact /
Privacy Policy /
Links /
About /
Day Trading Forum /
Investment Calculators /
Pivot Point Calculator /
Market Profile Generator /
Fibonacci Calculator /
Mailing List /
Advertise Here /
Articles /
Financial Terms /
Brokers /
Software /
Holidays /
Stock Split Calendar /
Mortgage Calculator /
Donate
Copyright © 2004-2023, MyPivots. All rights reserved.
Copyright © 2004-2023, MyPivots. All rights reserved.