ES Trading for 11-1-11
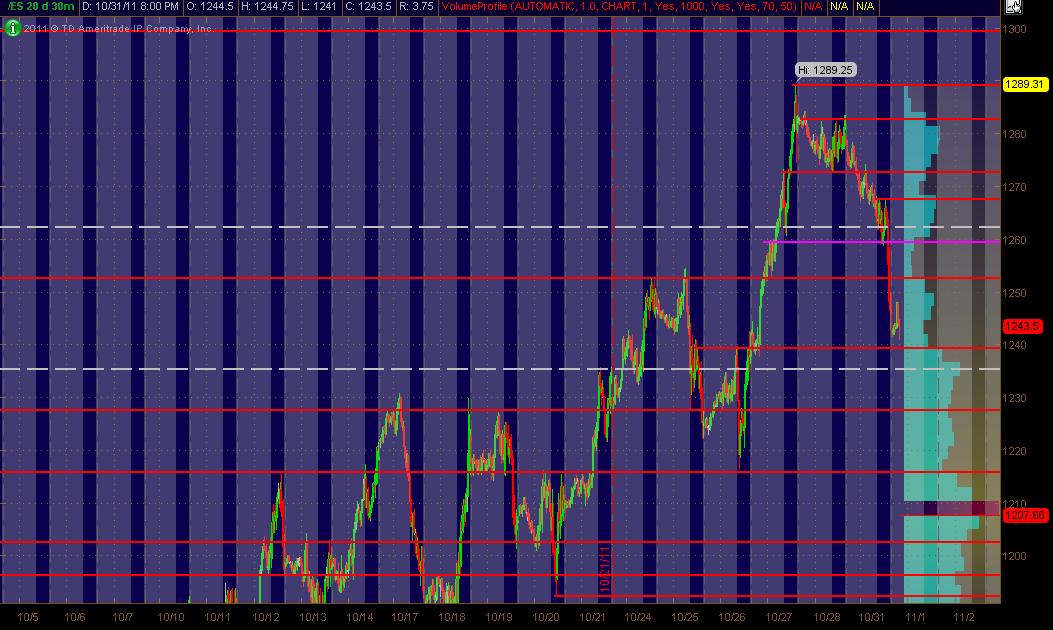
Here's what I've got as my revised MAP for Tuesday's trading ... 30min chart (20 days of data) of updated PASR levels/zones
Hope it's helpful to some!
Click image for original size
Hope it's helpful to some!
ISM below expectation
I made a video for the chart posted this morning and posted the video at YouTube. Had a ball doing it .
Here's the link:
Here's the link:
Originally posted by sandoxe
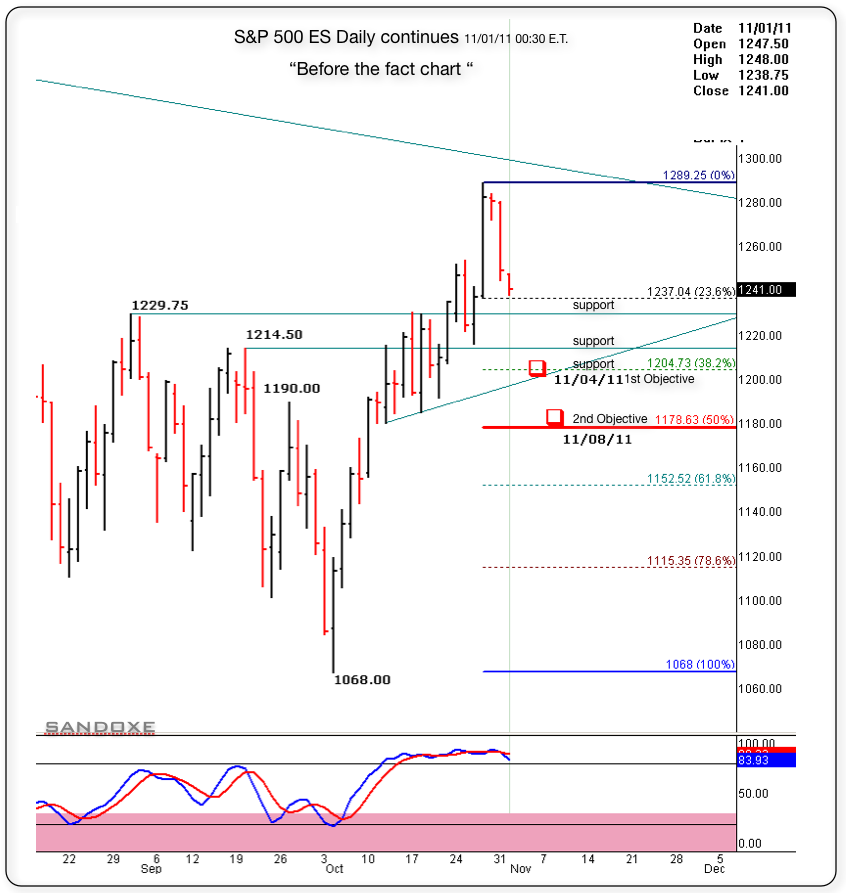
Below is the same daily chart posted last Thursday. In the chart you will notice that I have used the Fibonacci retrace levels to divide the previous up swing. (78.6% is not part of Fib. but I always used it).
Notice that the same S/R levels that where resistance when the market was moving up, are now support. I have the levels there bc they create the base for intraday trading.
For now I have two objectives. One at 1204.75 or 38% retrace and the other at 1178.75 or 50% retrace. The price could hit the objectives at that date or before that.
You have two objectives. How the heck do you play that? There are many different ways to play it. The one I use most, is play to the first objective and see how the price reacts at that S/R. If starts moving towards the next objective and I have the right set-up, then I will enter again, go with the trend! !
Other times I will take partial at first objective and let the rest run. If the market has strong momo I will just move my trailing stop close to it, till stops me out or hits the second objective. -- When you are in the middle of the battle you'll know what to do.
ES now trading 1238.50 01:57
As always, the market has the last word and in due time will show us the way.
Right now, next hours, next days, next weeks, next months and next years to come, I see for you the same I see for my self: Having the very best of luck, fun, awesome, incredibly profitable trading experience!!
Click image for original size
I'll be the first to admit that I am a novice at volume profile.
I am just a student right now, BUT
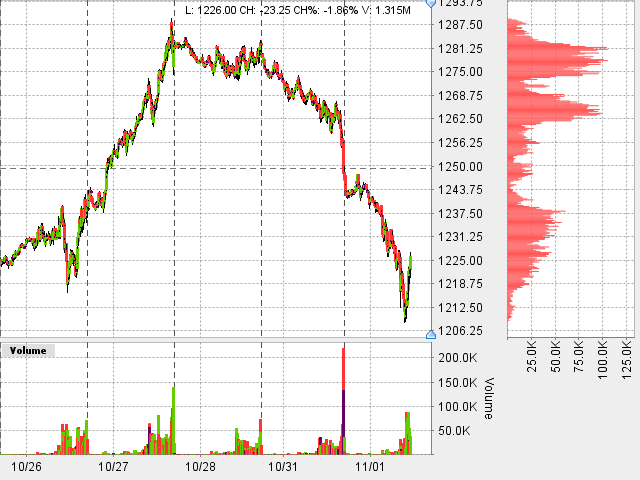
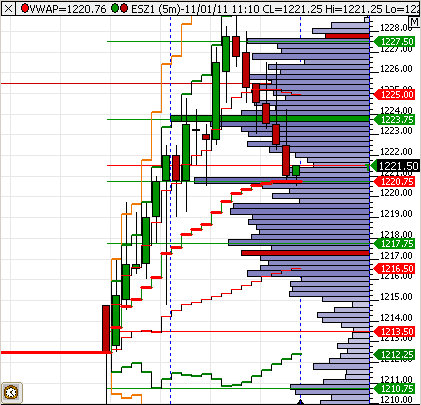
I do look at a 5 trade day roll of the VP and I feel compelled to point out 2 things
1) shorts have made the lion's share of their short-sided profits allready (for the immediate very short-term time horizon)
-and-
2) Bruce says price moves from lLVN to LVN.
If you look at the accompanying chart, there is a bell curve, (OK, it's a little lopsided), the LVN Lows have been right there near 1212. But look up higher on the chart, there is a ledge near 1238 (in the volume profile).
SHorts who shorted in the RTH and have held on during this rebound could easily get squeezed now. Maybe price can hit 1238
Also potentially buyllish, last week's RTH L of 1216 area was viewed by many as SUPPORT, this opens the upside for a potential test of the 50% of last week's RTH at 1252 area (the bigger the timeframe like week versus days, the bigger the variance in target zones).
Don't quote me on any of this. This is a novice observer of volume profile trying to make sense out of today's PA.
Hope I uploaded this chart correctly...
I am just a student right now, BUT
I do look at a 5 trade day roll of the VP and I feel compelled to point out 2 things
1) shorts have made the lion's share of their short-sided profits allready (for the immediate very short-term time horizon)
-and-
2) Bruce says price moves from lLVN to LVN.
If you look at the accompanying chart, there is a bell curve, (OK, it's a little lopsided), the LVN Lows have been right there near 1212. But look up higher on the chart, there is a ledge near 1238 (in the volume profile).
SHorts who shorted in the RTH and have held on during this rebound could easily get squeezed now. Maybe price can hit 1238
Also potentially buyllish, last week's RTH L of 1216 area was viewed by many as SUPPORT, this opens the upside for a potential test of the 50% of last week's RTH at 1252 area (the bigger the timeframe like week versus days, the bigger the variance in target zones).
Don't quote me on any of this. This is a novice observer of volume profile trying to make sense out of today's PA.
Hope I uploaded this chart correctly...
Click image for original size
TY, LisaP Everyone please realize, LisaP VP's are each day. The chart I posted is 5 days of volume at price (the volume profile on the right).
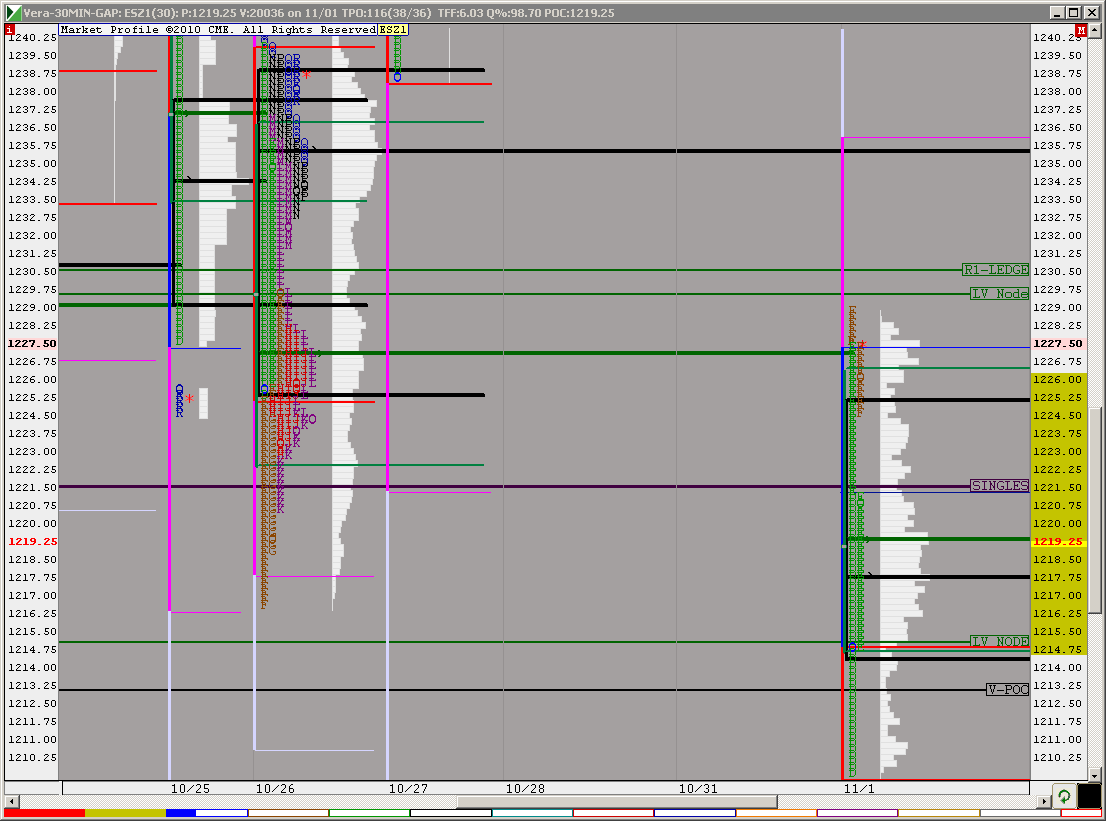
I have a very crude Market Profile program, singles are 1223-1221, that is the area that would have to attract buyers if the bears are going to get squeezed.
The current intraday RTH H is the resistance point.
Here's the toss-up question for valuable prize:
When is resistance more than likely no longer resistance?
answer: WHen price shoots through it in a large range bar. JMHO, WHY? because just getting a few ticks above the perceived resistance has triggered BUY STOPS (exits for shorts) that create a large range and can engender some followthrough.
Current RTH intreaday H = 1228.75
Am I playing this? no way.
I forgot to mention,
if you answered the question about "when is resistance no longer resistance" correctly (feel free to cheat by looking at the answer provided) ...then you win an invitation to my chainsaw party. The party starts today, around noon when I get that chainsaw fired up and attack all the limbs that came down in the October snbowfall (I live in PA)
Come on. You missed the weeding and mulch spreading party (everyone here was invited, no one showed up.) You missed the wood stacking party,
don't miss out on the Pennsylvania chainsaw massacre party.
Volume
Click image for original size
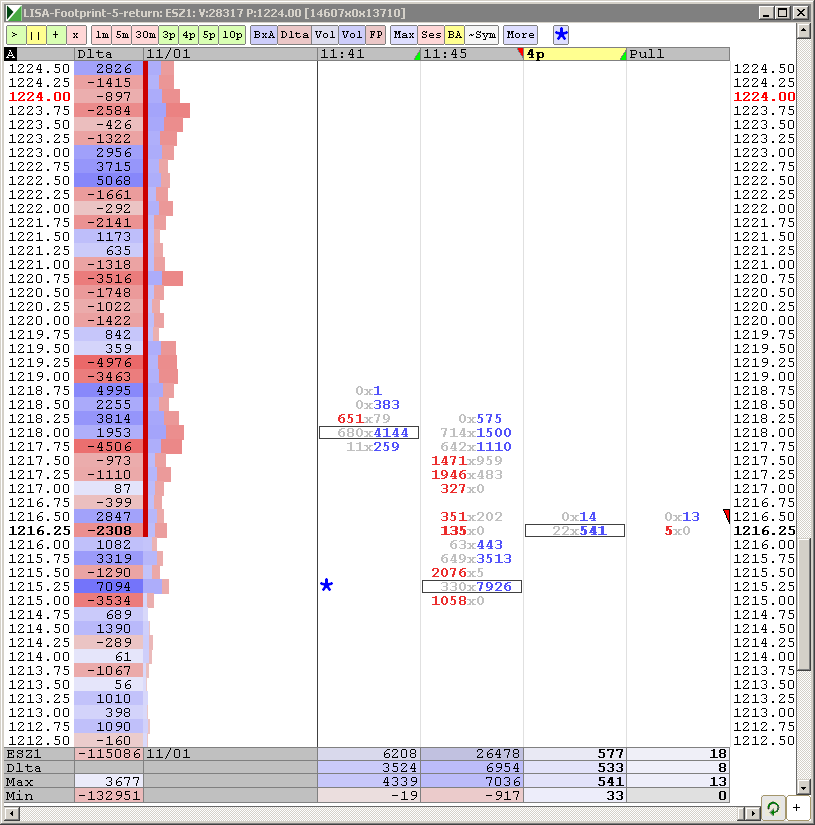
I have a VPOC at 1206-1207.
Hi Lisa,
I would appreciate if you could post the template or definition of your chart. Do you have a copy on the chart hub?
I would appreciate if you could post the template or definition of your chart. Do you have a copy on the chart hub?
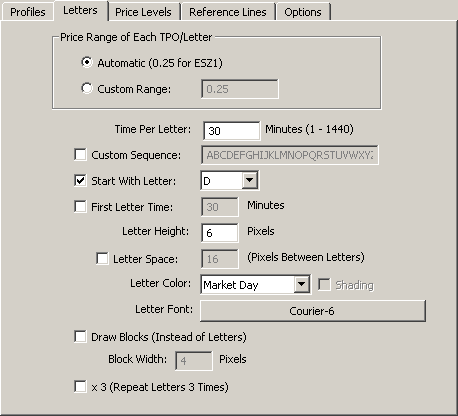
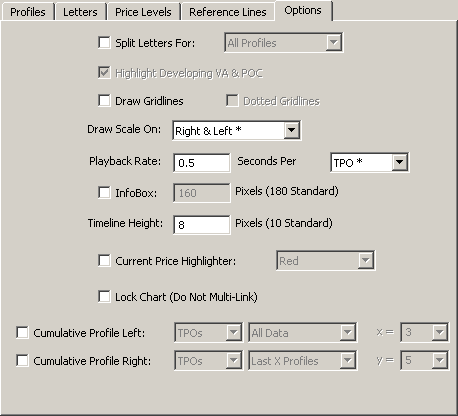
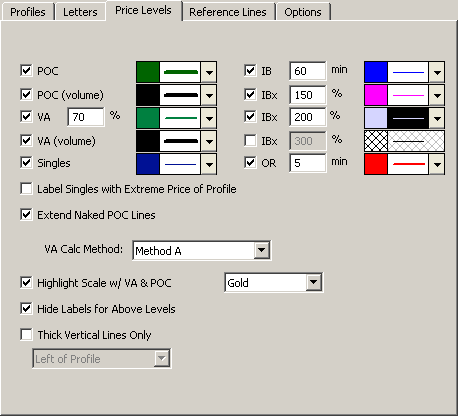
Enyamadi, here is My Profile chart settings in Market Delta. Open 30-min Profile chart. Right click on the chart, select Preferences. The following are the tabs, except Lines (which would be custom-created by you)
Click image for original size
Click image for original size
Click image for original size
Click image for original size

Emini Day Trading /
Daily Notes /
Forecast /
Economic Events /
Search /
Terms and Conditions /
Disclaimer /
Books /
Online Books /
Site Map /
Contact /
Privacy Policy /
Links /
About /
Day Trading Forum /
Investment Calculators /
Pivot Point Calculator /
Market Profile Generator /
Fibonacci Calculator /
Mailing List /
Advertise Here /
Articles /
Financial Terms /
Brokers /
Software /
Holidays /
Stock Split Calendar /
Mortgage Calculator /
Donate
Copyright © 2004-2023, MyPivots. All rights reserved.
Copyright © 2004-2023, MyPivots. All rights reserved.