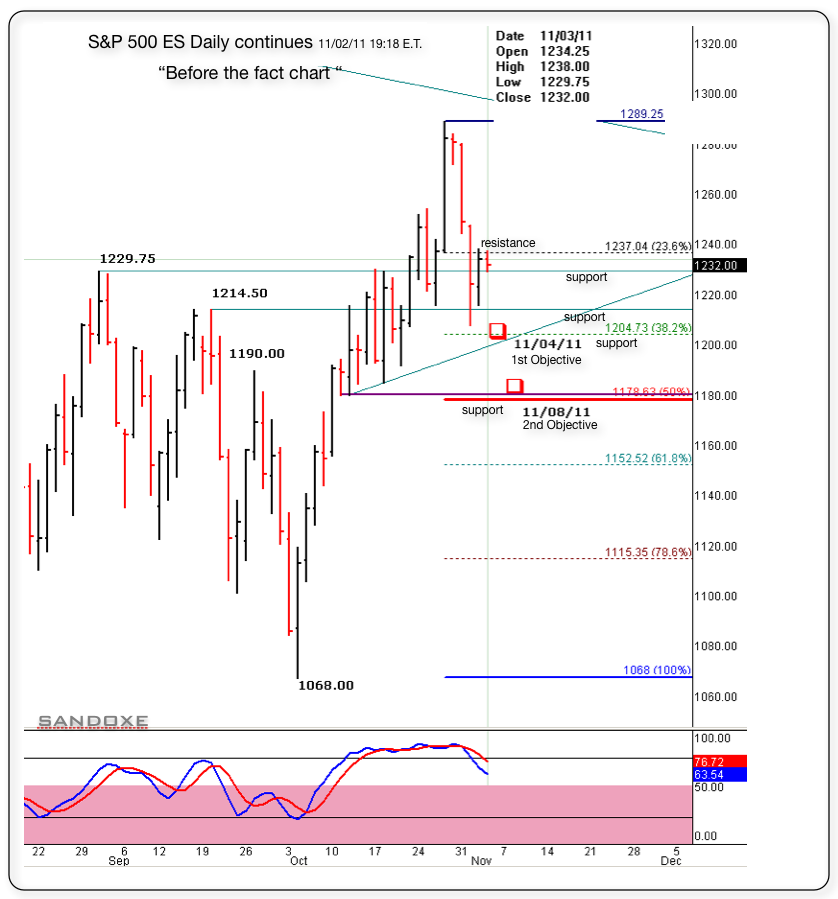
ES Thursday 11-3-11
Hey Bruce, I just hope you are a good sport and keep posting the way you always have!
I know I said that I will not post any more but NickP got me going with he's reverse psychology.
Basically today, I pointed out and trade from the 1237.00 area bc it is 38% Fibonacci retrace from 1283.50 high made on 10/28 at 16:01 and 1208.50 low made 11/01 at 08:52.
1237 area is also a Fibonacci 23.8% and it's acting as resistance. If you look at your intraday charts, you will see that the ES tested that area many times including late this afternoon in the O/N and was not able to find support.
Now ES is moving back down to test the next support area again, at 1214.50. Failure here will target 1204.00 and possibly 1178, same objectives as previously. Stops started above today's high now at B.E. 1236.00. Will see where it takes me.
Below is the same daily chart I had posted for some time now, last time was yesterday at 02:00.
Right now, next hours, next days, next weeks, next months and next years to come, I see for you the same I see for my self: Having the very best of luck, fun, awesome, incredibly profitable trading experience!!
Click image for original size
Using KT I am watching for 1237.75 based on the full projectioin off the move from 54.75-48.25
della,
Bruce really is taking vacations. If he does post over the next few weeks it will only be because he happens to be at a computer and wants to post.
I can't even trade today, death in the family and the arrangements are more complicated and time consuming than I ever thought possible.
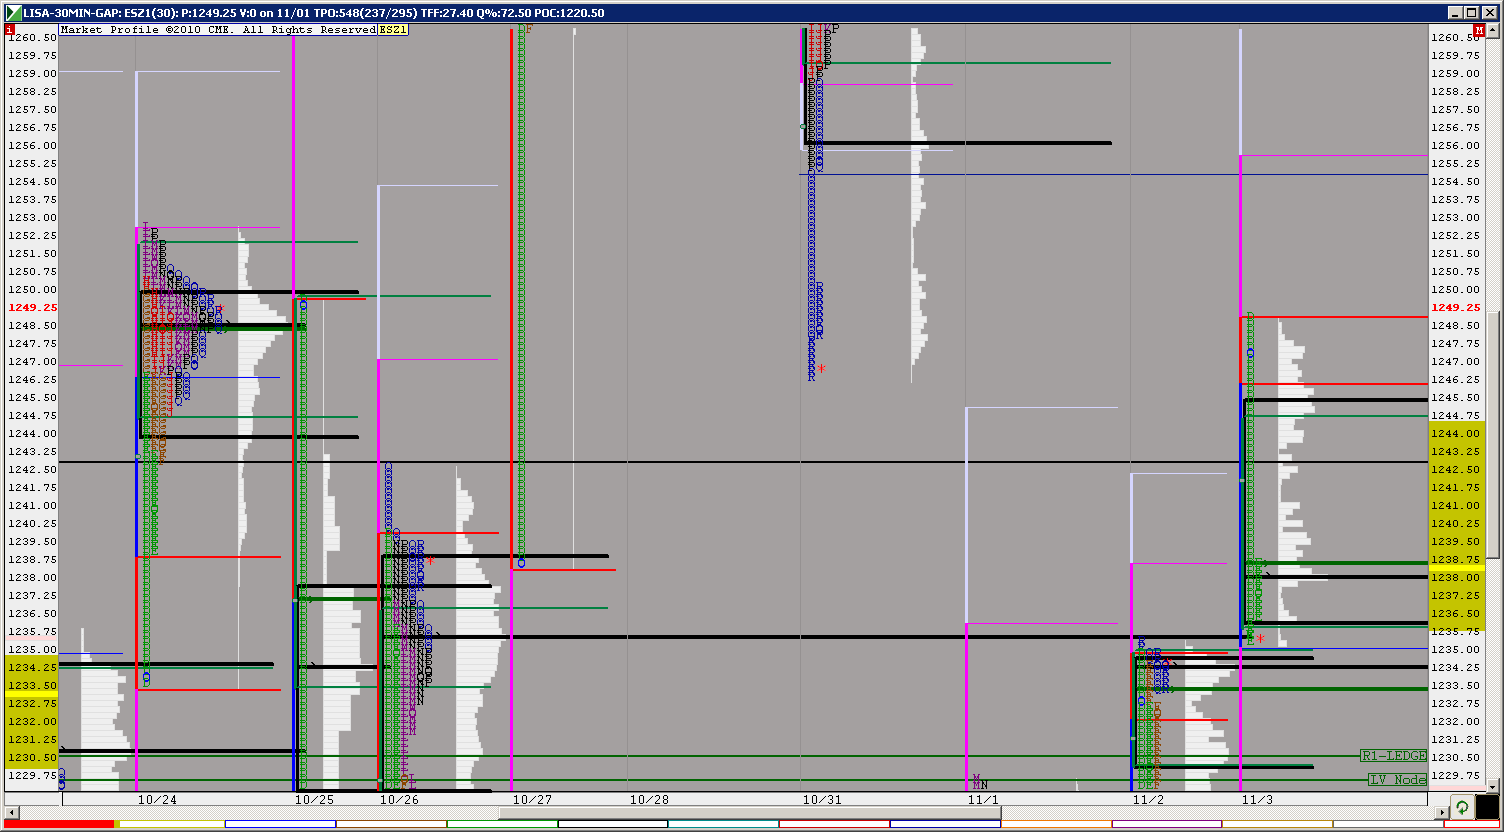
I did look at the overnight volume profile, geez, look at that 34.25 (overnight) POC. I know Bruce said he only uses the overnight to confirm RTH V profile, but that spike I see just seems like the biggest invitation for a price visit.
Traders who trade big money and only trade RTH, and missed the ECB rate cut boat might force prices down there searching to unleash volume (and maybe take LONG positions.
I'm too busy with other things to trade (think of all the money I'll save! LOL
Good Luck to all.
Bruce will be back (he can't help himself), but he is taking mini vacations right now.
Bruce really is taking vacations. If he does post over the next few weeks it will only be because he happens to be at a computer and wants to post.
I can't even trade today, death in the family and the arrangements are more complicated and time consuming than I ever thought possible.
I did look at the overnight volume profile, geez, look at that 34.25 (overnight) POC. I know Bruce said he only uses the overnight to confirm RTH V profile, but that spike I see just seems like the biggest invitation for a price visit.
Traders who trade big money and only trade RTH, and missed the ECB rate cut boat might force prices down there searching to unleash volume (and maybe take LONG positions.
I'm too busy with other things to trade (think of all the money I'll save! LOL
Good Luck to all.
Bruce will be back (he can't help himself), but he is taking mini vacations right now.
thank s for the heads up
Just got in. Sorry about Bruce taking a vacation from this Forum. Miss him already.
Here is a wide-angle view. Looks like we will be filling a thinly-traded area
Here is a wide-angle view. Looks like we will be filling a thinly-traded area
Click image for original size
Originally posted by prestwickdrive
Using KT I am watching for 1237.75 based on the full projectioin off the move from 54.75-48.25
With bust of 37.75 the next cycle I am watching is 54.75-44.25 giving a full projection of 1227.25 and an initial of 1237.75 that matched the full earlier one and was taken out. On a larger move I notice that the mid point of the initial projection frequently proves to be a tradable inflection point. IN this case that is 1232.5. It works well for me for crude oil and natural gas which I primarily trade but it also seems to work for the ES. Sorry for the late posts - crude is my bread and it has been very active today.
At this point 1240-1244 is now resistance point as prices just collapsed down through them. Also using 5-min chart a projection up using 30.5-35 gives a 2.618 number of 42.50 and the developing profile is showing LVN in this area. We might have already seen the reversal here. One of the 60min edges is going to get tested...
Here is the chart. You can see that LVN just above the latest pivot of 40.50.
Click image for original size
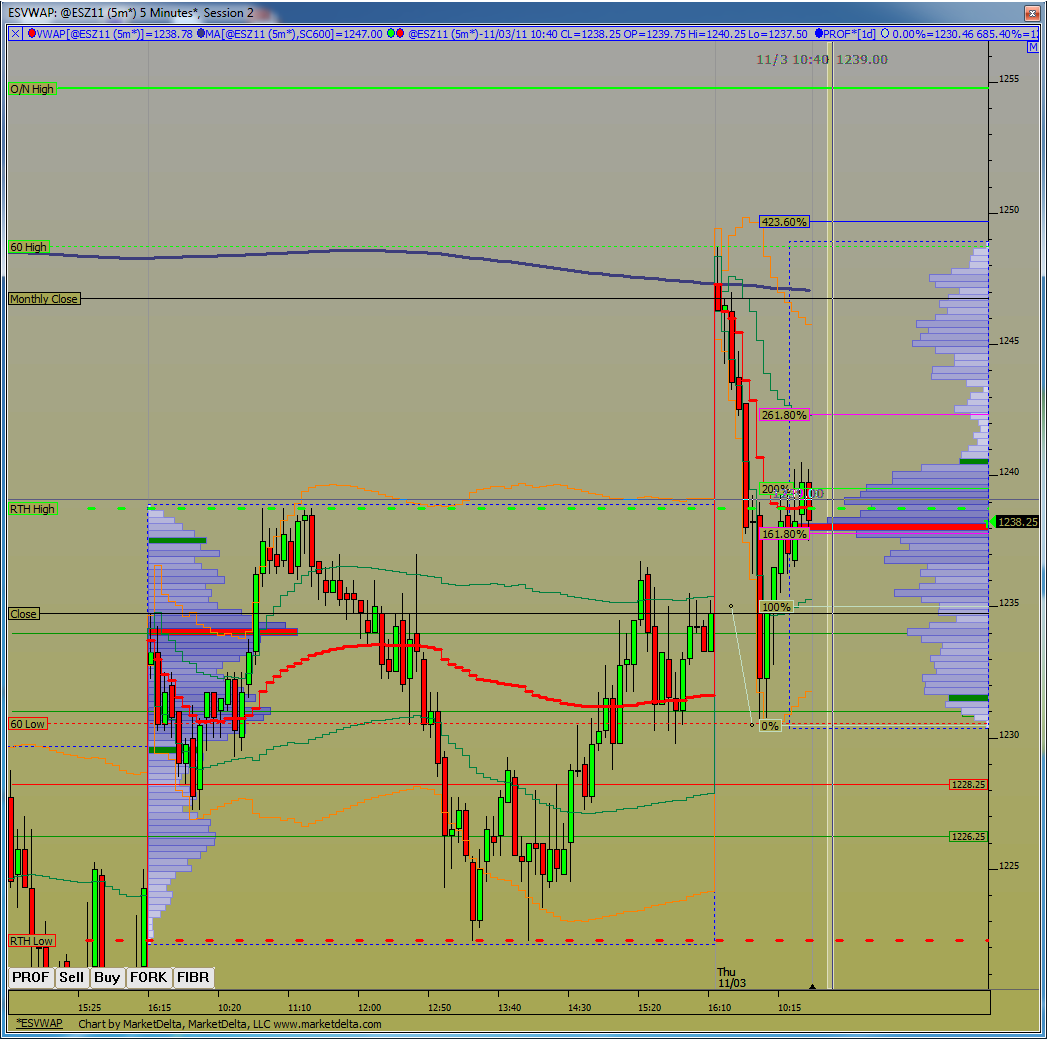
One more addition. Prices gapped up into that 600 period MA (thick blue line) and immediately reversed to come back to yesterday's value. As Paul suggested big money who missed the early morning ECB rate announcement might be pushing this thing back up. Watch very carefully if price get back to that 600MA zone. If it holds then prices will most likely drop all the way back down to the lows but if it doesn't hold I would be looking for a big spurt higher.
Single sitting at 1254.75
Single sitting at 1254.75
Just wondering - did anyone do a KT projection on the cycle from 1230.5 - 1236.25?
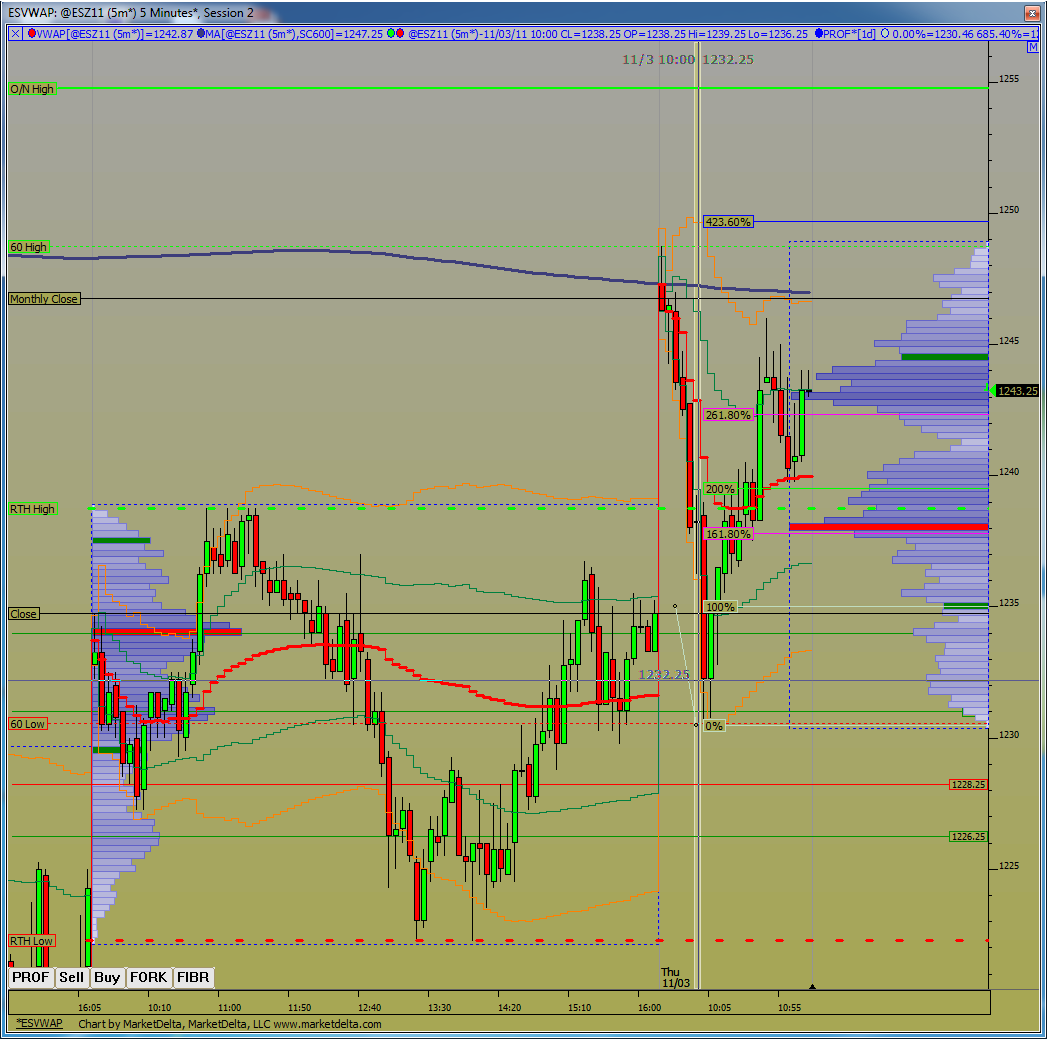
Update on today's progress. That LVN has gotten smaller/tighter as volume fills it in. Still an interesting inflection point and that 600MA sits just above which also happens to be Octobers Closing price.
Click image for original size
doing battle at that 1262.25 this EARLY a.m. ..
Emini Day Trading /
Daily Notes /
Forecast /
Economic Events /
Search /
Terms and Conditions /
Disclaimer /
Books /
Online Books /
Site Map /
Contact /
Privacy Policy /
Links /
About /
Day Trading Forum /
Investment Calculators /
Pivot Point Calculator /
Market Profile Generator /
Fibonacci Calculator /
Mailing List /
Advertise Here /
Articles /
Financial Terms /
Brokers /
Software /
Holidays /
Stock Split Calendar /
Mortgage Calculator /
Donate
Copyright © 2004-2023, MyPivots. All rights reserved.
Copyright © 2004-2023, MyPivots. All rights reserved.