ES Friday 11-4-11
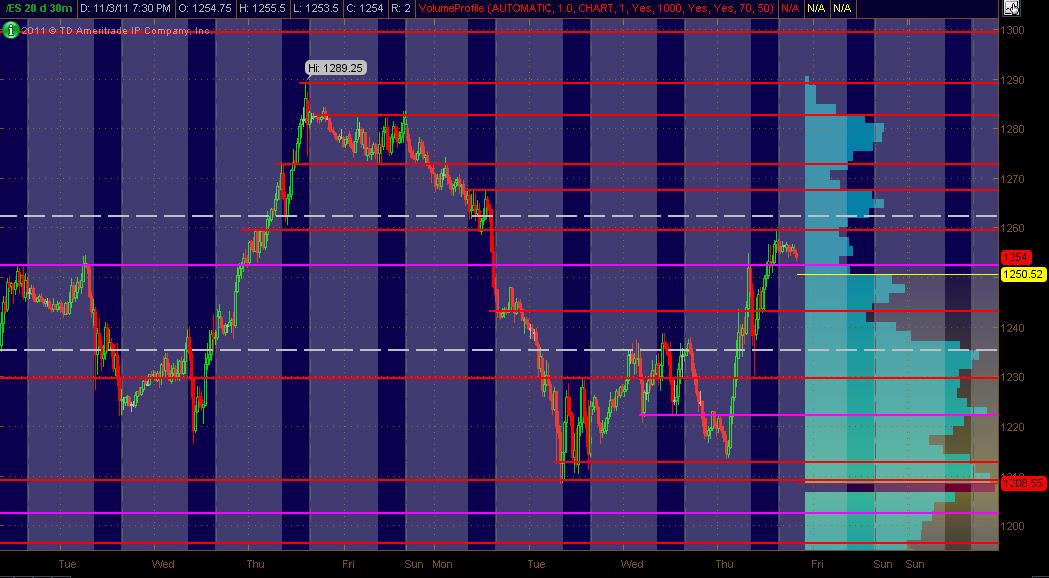
Here's my updated Monkey Map of 20-days worth of 30min chart action displaying All Trading Hours as a for what I'm looking at coming into Friday. The Red lines are potential significant PASR levels with Magenta lines being semi-significant. The White dashed lines are the Wkly Pivots. The right vertical axis shows 20 days of Volume Profile in Light Blue. The background displays RTH in Blue with "after hours" in Gray. As always, I hope this is helpful for some folks.
With the mkt being so news driven lately ... gotta take the levels/zones with a grain of salt and watch what price action is doing when it nears any ZONE.
Click image for original size
With the mkt being so news driven lately ... gotta take the levels/zones with a grain of salt and watch what price action is doing when it nears any ZONE.
No#'s@49 this morning, yet the short@49 was very clear from the DX + VOLD and it gave every reason to hold.. No matter what the numbers are underneath, still no reason to look for longs..
Lorn, further to our discussion - untested breakout
Click image for original size
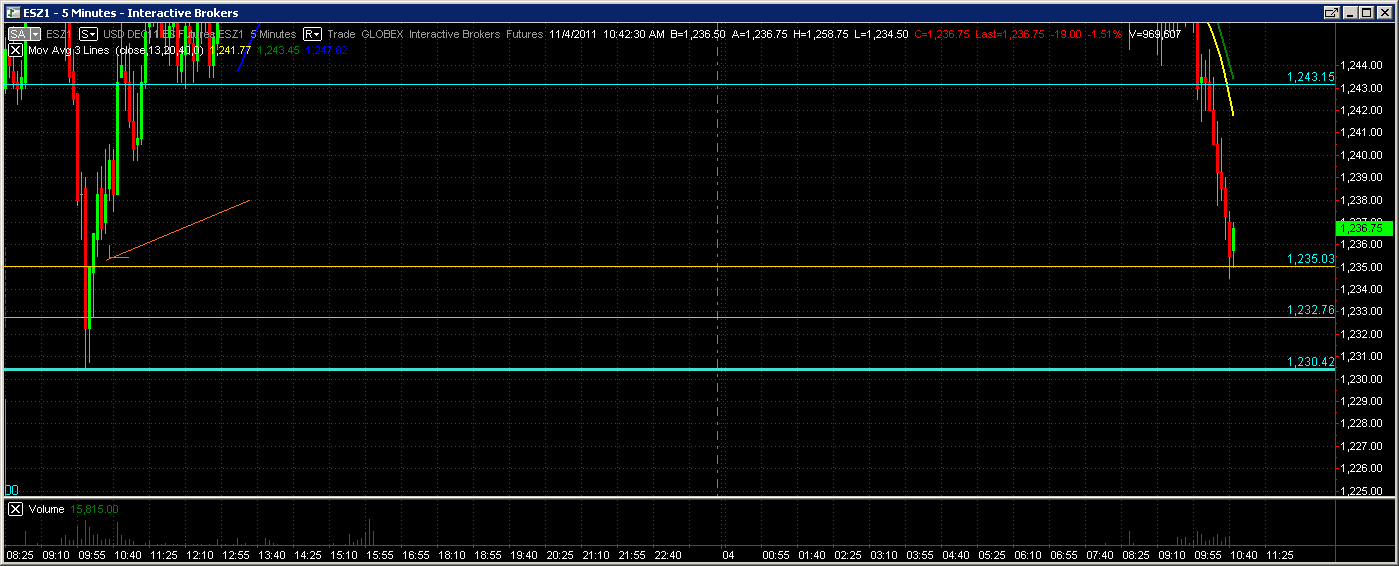
That was 5-min chart
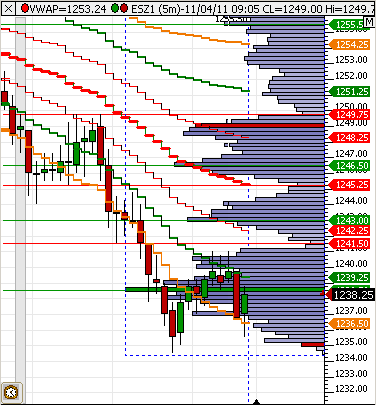
shallow retracements, weak tick, ADD confirmed direction.. They will also be the 1'st to tip you off where the market may reverse.. The levels are secondary.. A road map to where the market "might" be headed..
There is volume to the upside now.. this may be a bottom here, but will need retracement
GRPN opened for trading
it's a show folks
If you like fibs I highly recommend reading Roofers "Slate Pile" posts.
In between the 38% levels and the 62% levels is the midfield'
Outside is the Red Zone. A simplification if you like.
Just in case the 1223.75 is the top ofthe range for the last few months with 1215 the mega 50% level.(per earlier bearish post this week.
Yesterdays high is a lower high so far.
It looks like a one sided market to me but if you missed the short this morning, you're either stranded or forced to take the long side, where you have to pick a bottom, and it will be VERY hard to hold.. at least for me... how far will it go? You can call it right and not go far...
In case my meaning is missing.
That 38% retrace level down is the 62% level of the wave up.
Trying to get back into the red zone here.
That 38% retrace level down is the 62% level of the wave up.
Trying to get back into the red zone here.
The tick and ADD are the 1'st to show reversal, yet the bias remains unchanged.. by the time the VOLD and DX confirms, you're late... You're forced to place the trade ahead of the bigger bias... Its often worth a shot, but no ideal.. Most are forced to take those types of trades and that's why trading is so difficult.. psychologically and etc...
Those "past posting winning trades" you're referring to were hardly meant to show off if that's how you read into it though I don't see how... You want me to predict trades in advance before they set up but many factor cannot be predicted and most of us see the same MP levels so there is no need to repeat those.. Imagine if I called out a trade in advance and someone gets stopped out............
Emini Day Trading /
Daily Notes /
Forecast /
Economic Events /
Search /
Terms and Conditions /
Disclaimer /
Books /
Online Books /
Site Map /
Contact /
Privacy Policy /
Links /
About /
Day Trading Forum /
Investment Calculators /
Pivot Point Calculator /
Market Profile Generator /
Fibonacci Calculator /
Mailing List /
Advertise Here /
Articles /
Financial Terms /
Brokers /
Software /
Holidays /
Stock Split Calendar /
Mortgage Calculator /
Donate
Copyright © 2004-2023, MyPivots. All rights reserved.
Copyright © 2004-2023, MyPivots. All rights reserved.