ES SRs and Fibs 11/10/11
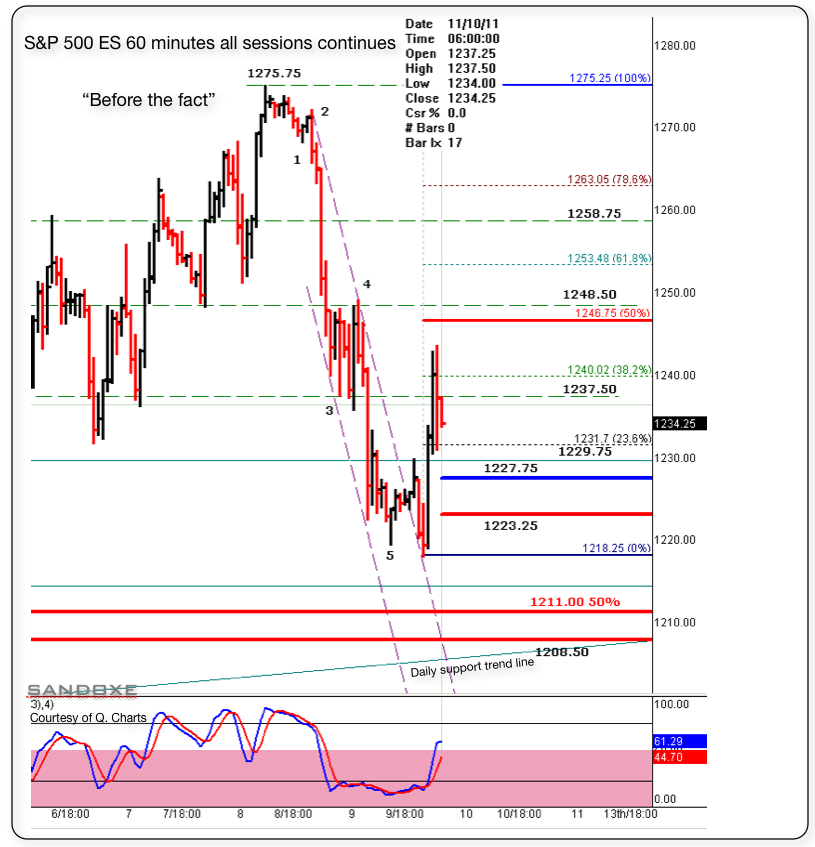
Below is a 60 minutes chart with today's session set-up. The blue (1227.75) and red line (1223.25) are my guide lines to focus on buying or selling. If the price is above 1227.75 I will focus on buying set-ups from S/Rs. Conversely, if the price is below 1227.75, I will focus on short set-ups from S/Rs and so on.
As always, the market has the last word and in due time will show us the way.
Right now, next hours, next days, next weeks, next months and next years to come, I see for you the same I see for my self: Having the very best of luck, fun, awesome, incredibly profitable trading experience!!
As always, the market has the last word and in due time will show us the way.
Right now, next hours, next days, next weeks, next months and next years to come, I see for you the same I see for my self: Having the very best of luck, fun, awesome, incredibly profitable trading experience!!
Click image for original size
DavidS. Below is the video from yesterday's action and in it, I placed the posts made here. The posts indicate where the market was when I posted them.
If people have any Qs, please ask.
P.s. lower your puter's volume, just in case.
Thx.
If people have any Qs, please ask.
P.s. lower your puter's volume, just in case.
Thx.
I'll have to watch later.
See my last post in yesterdays thread.
See my last post in yesterdays thread.
Back in the field of play at the open and those same levels.
1239.50 the line to hold in the 1239.50,1249, and 1258.50 range(38,50,and 62% levels smaller scale).
1244,1246.50,1249 and 1250(large scale 62% level) above. If want higher,needs to get above 1250 and Hold at some point.
If going higher for the holidays time is short(Hint,speed =angle).
A downward move below possible out and back in the range.
Still have all that prevously discussed above. Baseline,1274,1283.
1234.75 area the field top created by this O/N lift.
31.50 and 28.50 the other levels below.
31.50 and 28.50 the other levels below.
Once 39.50 breaks those targets posted yesterday are reactivated(although 1222 definitely accomplished if corrective).
The levels in my last post prior to this,1223.75,and 1215 the only barriers below,besides the higher lows.
The angle =speed works in both directions.
The levels in my last post prior to this,1223.75,and 1215 the only barriers below,besides the higher lows.
The angle =speed works in both directions.
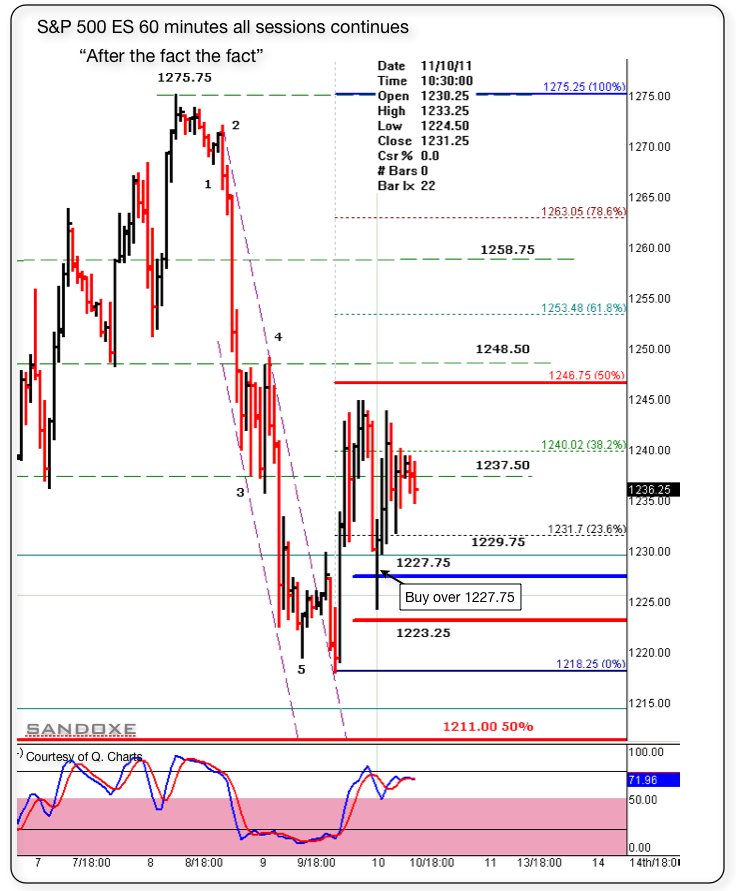
Below is the 60 minutes follow up chart from the one posted this morning at 06:38
Notice that there was a nice hit on that 1227.50 "buy blue line" Same as yesterday, but yesterday was on the sell side. there was only one hit on that "sell red line"
Notice that there was a nice hit on that 1227.50 "buy blue line" Same as yesterday, but yesterday was on the sell side. there was only one hit on that "sell red line"
Click image for original size
Originally posted by sandoxe
Below is a 60 minutes chart with today's session set-up. The blue (1227.75) and red line (1223.25) are my guide lines to focus on buying or selling. If the price is above 1227.75 I will focus on buying set-ups from S/Rs. Conversely, if the price is below 1227.75, I will focus on short set-ups from S/Rs and so on.
As always, the market has the last word and in due time will show us the way.
Right now, next hours, next days, next weeks, next months and next years to come, I see for you the same I see for my self: Having the very best of luck, fun, awesome, incredibly profitable trading experience!!
Click image for original size
Thanks Sandoxe;
That 1218.25 was, for lack of a better term, a measured distance target for me ... the spot was 1218.50 .. "they" pushed it thru one tick .. LOL
Got'a have plenty of coffee that early in the morning to see these things ..
That 1218.25 was, for lack of a better term, a measured distance target for me ... the spot was 1218.50 .. "they" pushed it thru one tick .. LOL
Got'a have plenty of coffee that early in the morning to see these things ..
YW. Redsixspeed. I have so much coffee some times that 24 hrs without sleep is nothing now days. LOL
The reverse has happened to me. The market miss my SLs by one tick! Sucks when it does that!
That 1218.50 was also a 5 flat! What a beauty set-up too, perfect exit or entry (reversal) Don't see them set-ups that often.
Do you notice? they started right on the time bracket. Some times they start at 03:30. I missed that one. Was up at 05:00
Emini Day Trading /
Daily Notes /
Forecast /
Economic Events /
Search /
Terms and Conditions /
Disclaimer /
Books /
Online Books /
Site Map /
Contact /
Privacy Policy /
Links /
About /
Day Trading Forum /
Investment Calculators /
Pivot Point Calculator /
Market Profile Generator /
Fibonacci Calculator /
Mailing List /
Advertise Here /
Articles /
Financial Terms /
Brokers /
Software /
Holidays /
Stock Split Calendar /
Mortgage Calculator /
Donate
Copyright © 2004-2023, MyPivots. All rights reserved.
Copyright © 2004-2023, MyPivots. All rights reserved.