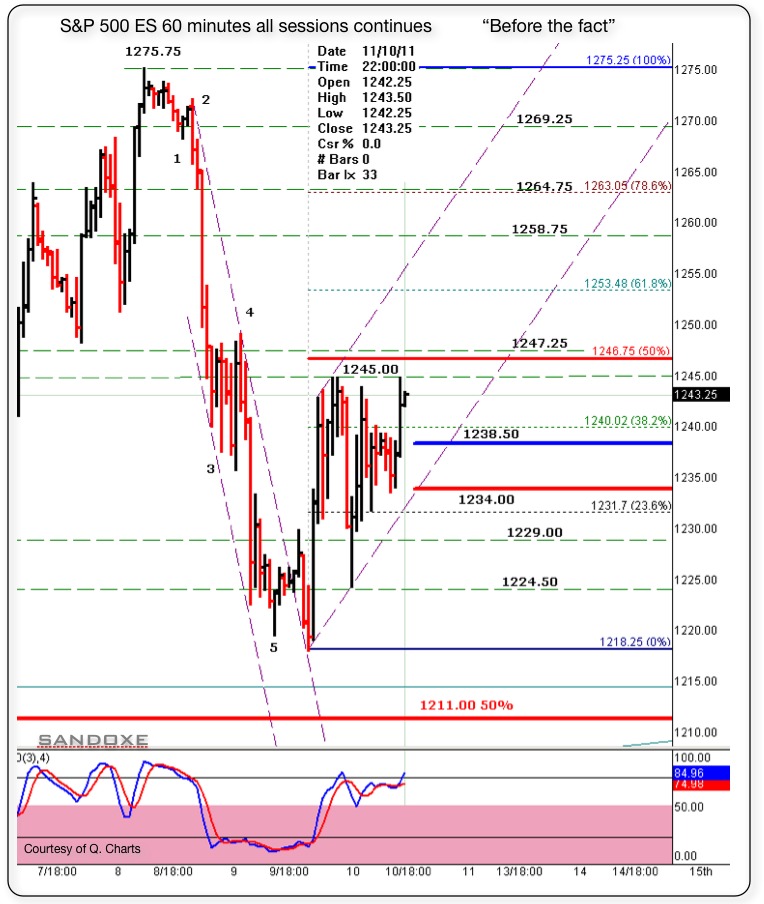
ES SRs and Fibs 11/11/11
Below is a 60 minutes chart with today's session set-up. The blue (1238.50) and red line (1234.00) are my guide lines to focus on buying or selling. If the price is above 1238.50 I will focus on buying set-ups till it gets to some type of resistance to revaluate. Conversely, if the price is below 1234.00, I will focus on short set-ups till the price gets to some type of support to revaluate the trade and so on.
As always, the market has the last word and in due time will show us the way.
Right now, next hours, next days, next weeks, next months and next years to come, I see for you the same I see for my self: Having the very best of luck, fun, awesome, incredibly profitable trading experience!!
As always, the market has the last word and in due time will show us the way.
Right now, next hours, next days, next weeks, next months and next years to come, I see for you the same I see for my self: Having the very best of luck, fun, awesome, incredibly profitable trading experience!!
Click image for original size
DavidS, just back from the senior home where we heard from both war veterans and Holocaust survivors. One man was in four concentration camps. His stories were recorded by Spielberg and we watched on of his interviews with Canadian Broadcasting Corporation. It was an emotional event. Thanks for bringing the topic up.
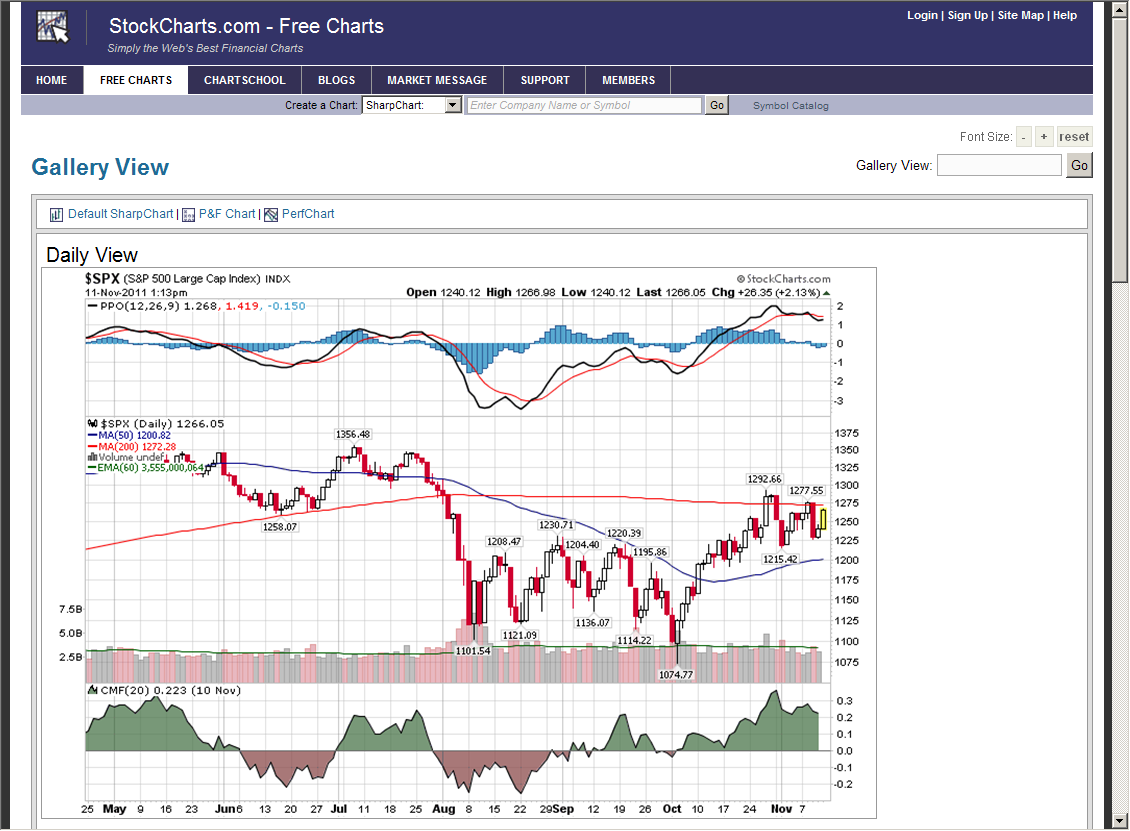
As for $SPX (cash), it is at important level - 200MA on daily
As for $SPX (cash), it is at important level - 200MA on daily
Click image for original size
Sandoxe,
Love the charts......
Love the EW stuff....I think the 5 should be at the bottom though....
Those C waves are strong.....huh?
Love the charts......
Love the EW stuff....I think the 5 should be at the bottom though....
Those C waves are strong.....huh?
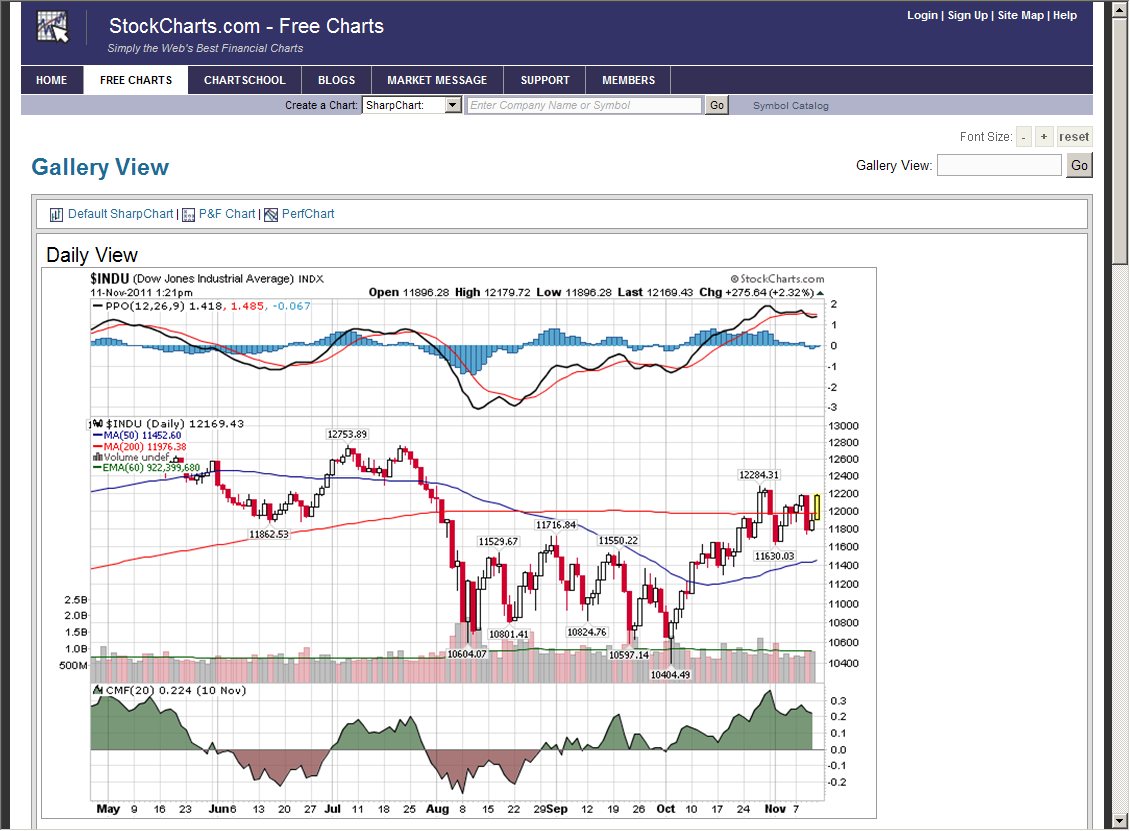
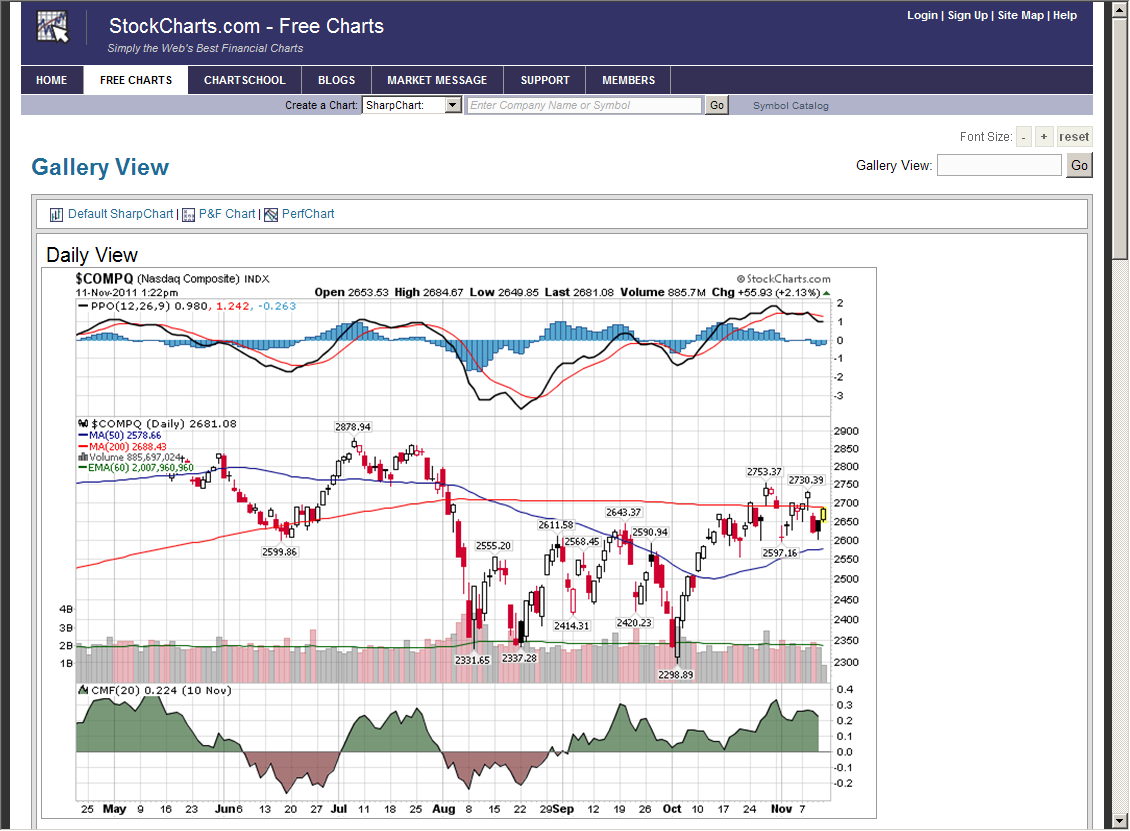
Since we are on topic of cash, here are daily charts of INDU and COMPQ. Note the proximity of 200 MA
Click image for original size
Click image for original size
DavidS, for you. "KISS" was filmed in Iraq at a USO tour of a US Marine Base.
Note, Gene Simmons is without makeup....lol.
http://www.youtube.com/watch_popup?v=5MtdIO23MKM
Note, Gene Simmons is without makeup....lol.
http://www.youtube.com/watch_popup?v=5MtdIO23MKM
Sluggish, and this too will end at some point.
Have posted the extension levels one has to work with til they are broken. If scalping the range and between tight levels I note the 50% level between the levels(especially in a tight range). It also helps in trading larger ranges.
The example here is between 60.50 and 64.
3.5 points. That gives 1.75 when equally divided and 1262.25 the mean. Strentgh above,weakness below.
Higher lows and lower highs occur in all timeframes/tick charts.S/R is fractal too. Every top and bottom has an alpha that is not visible on the smallest chart.
At 62.25
Thanks Lisa!
Will enjoy it later.
Also want to thank you for your volume charts.
I really don't use it but do study it for possible application. Nothing so far, but your charts extremely interesting and valuable to me for my purpose.
Will enjoy it later.
Also want to thank you for your volume charts.
I really don't use it but do study it for possible application. Nothing so far, but your charts extremely interesting and valuable to me for my purpose.
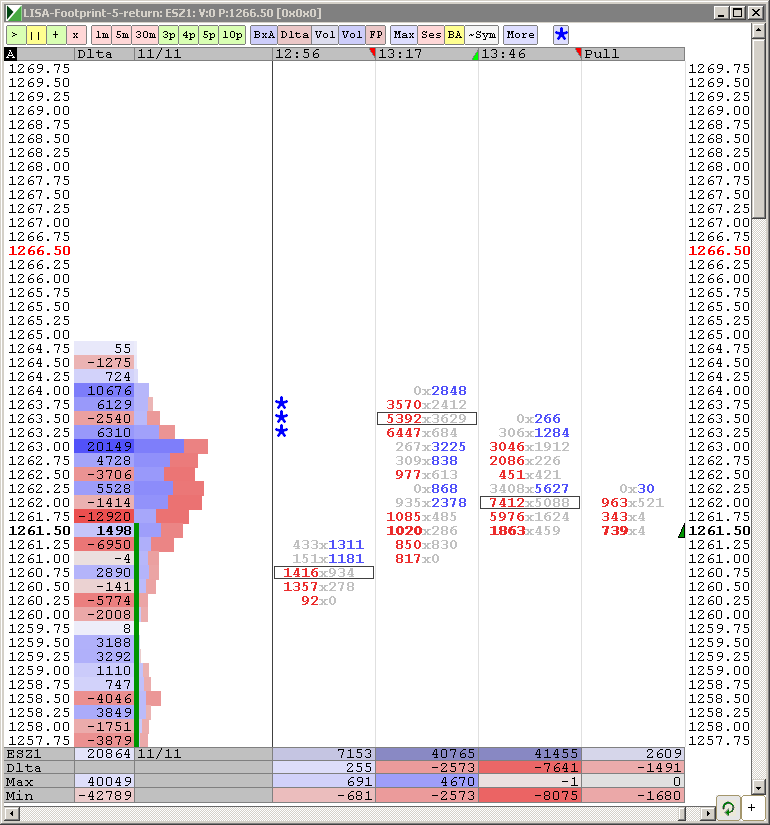
Good volume (for this time of day). Plus "they" came back three more times to it, so the real accumulated volume is larger. I am short.
Click image for original size
LisaP,
I use YM (DOW) to test and they are really selling the 12115 to 12130 level......I rarely see that many contracts on YM.
It topped out at 12142......12144 was the top before the big 400 point drop........
I use YM (DOW) to test and they are really selling the 12115 to 12130 level......I rarely see that many contracts on YM.
It topped out at 12142......12144 was the top before the big 400 point drop........
Drednfer, what program do you use to see large selling? Market Delta? Or your broker's Time and Sales?
I hate trading against the trend...
Thx Vasuki. I hope he has more than one broker acct.
Originally posted by vasuki
Sandoxe just to let you know Don miller may have lose over 2 million in his MF GLOBAL account check his web site has a lot of info about the litigation and so on.
Emini Day Trading /
Daily Notes /
Forecast /
Economic Events /
Search /
Terms and Conditions /
Disclaimer /
Books /
Online Books /
Site Map /
Contact /
Privacy Policy /
Links /
About /
Day Trading Forum /
Investment Calculators /
Pivot Point Calculator /
Market Profile Generator /
Fibonacci Calculator /
Mailing List /
Advertise Here /
Articles /
Financial Terms /
Brokers /
Software /
Holidays /
Stock Split Calendar /
Mortgage Calculator /
Donate
Copyright © 2004-2023, MyPivots. All rights reserved.
Copyright © 2004-2023, MyPivots. All rights reserved.