ES SRs and Fibs 11/14/11
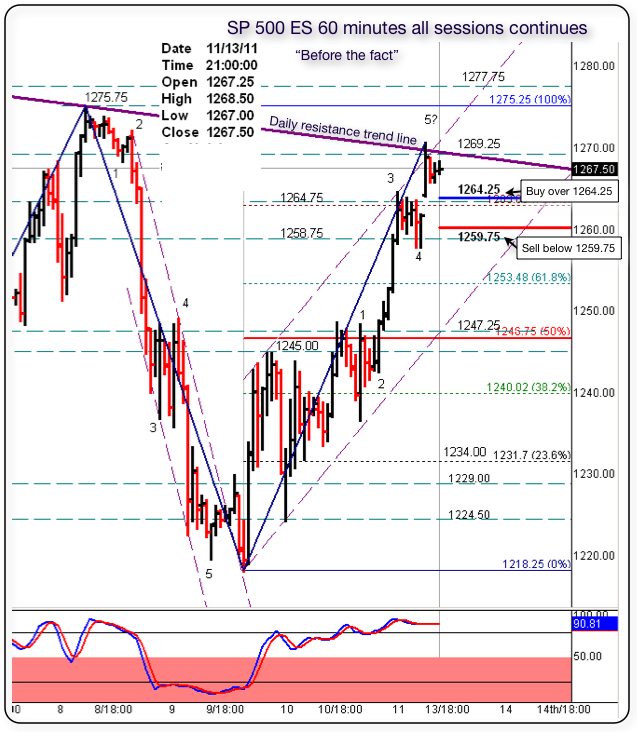
Here is the 60 minutes chart set-up with the various S/Rs levels. The E.W. ( Elliot Wave ) count posted Friday afternoon was correct and the 5th wave unfolded in the O/N tonight hitting 1269.00. and testing the daily resistance trend line shown in the chart.
IMO - If the market is really bullish, it should not retrace too much or lower than 1253.00
But as always, the market has the last word and in due time will show us the real deal in dollars and cents.-.
Here is what I said Friday.
___________________________________________________
sandoxe | 11-Nov-2011 at 2:41 PM | Rep: 470 | Posts: 290
Thx Grednfer . Looking at the 10m chart all sessions. If my count is correct, we are currently on a 4 of 3. If so then what you see in the 10m. chart as a possible top is the a,b,c,d,e formation. Market will move up after the e is completed. The objective is at 1269 end of session and a possible 1275 resistance test in O/N.
Will see in due time the market will show us the way.
ES now trading 1262.75 @ 14:40 E.T.
____________________________________________________
Right now, next hours, next days, next weeks, next months and next years to come, I see for you the same I see for my self: Having the very best of luck, fun, awesome, incredibly profitable trading experience!!
Click image for original size
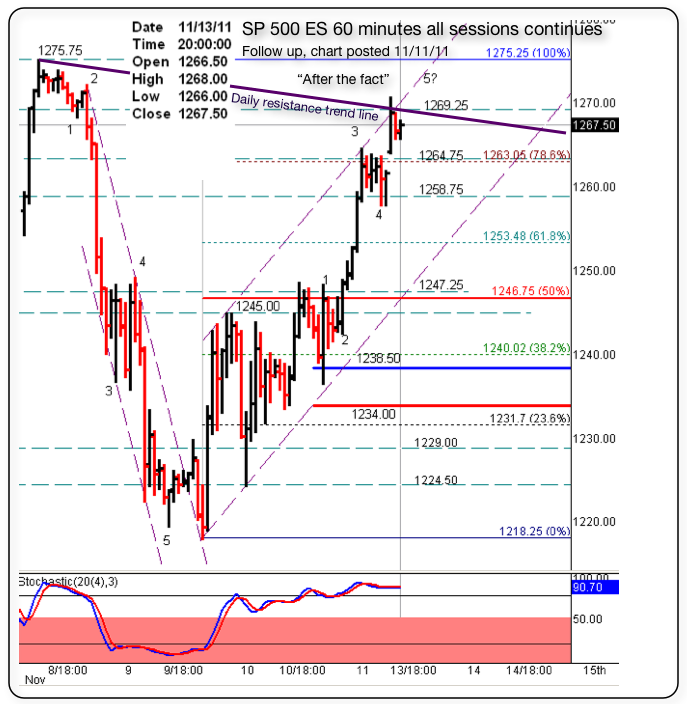
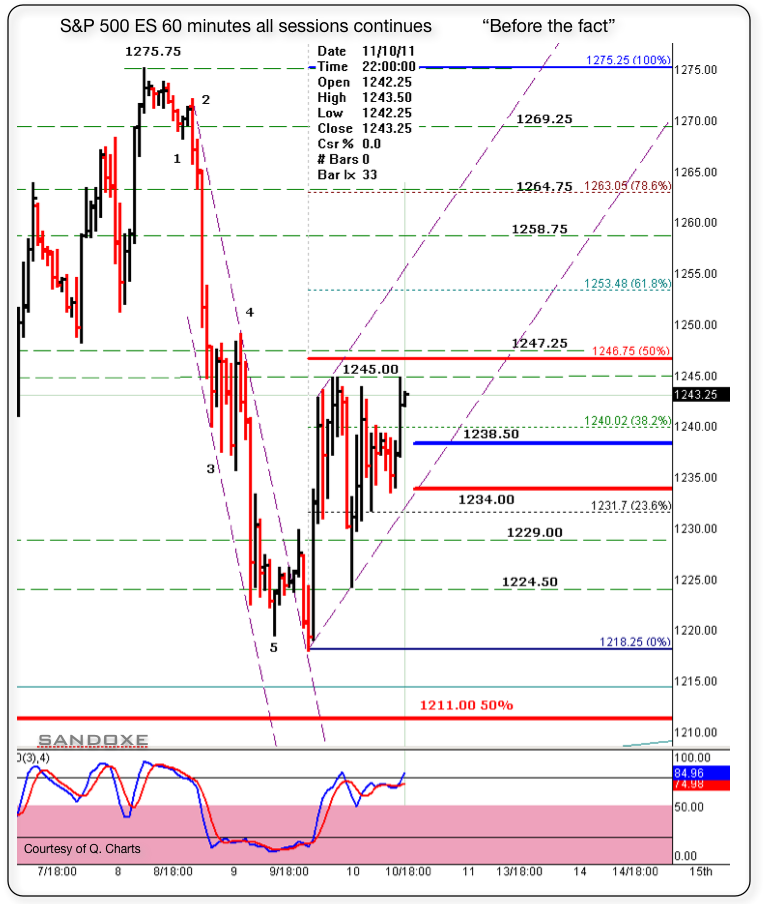
Below is the follow up chart for the one posted 11/11/11. (below that is the original chart)
Notice that the price hit that 1238.50 blue line and never looked back. Same as the day before. Hits that line and never looks back. Night traders are active now days.
Well, other times the price does zig-zags between the two lines and it's a pain in the ....
Notice that the price hit that 1238.50 blue line and never looked back. Same as the day before. Hits that line and never looks back. Night traders are active now days.
Well, other times the price does zig-zags between the two lines and it's a pain in the ....
Click image for original size
Click image for original size
If you're really into EW, you should check out this site.....
http://pretzelcharts.blogspot.com/
I don't trade EW, its too hindsight for me.....just momo....its always right.
http://pretzelcharts.blogspot.com/
I don't trade EW, its too hindsight for me.....just momo....its always right.
No thank you LOL. What a trip! The only reason I'm posting E.W.s is bc they show up in the last few days. I will not want to be labeling every little move, no way! 5 waves and the 4 wave a.b.c..d.e. is as far as I go. - wave 3 momo I like.
Elliot wave is just one of my tools in my trading tool box.-.-.
Elliot wave is just one of my tools in my trading tool box.-.-.
Originally posted by grednfer
If you're really into EW, you should check out this site.....
http://pretzelcharts.blogspot.com/
I don't trade EW, its too hindsight for me.....just momo....its always right.
So far it's ascending H&S baseline(1267 area) 3-index o
a sharp lift needed to break/pierce even if corrective to exceed 1283
Eyeing 48.25 and 50.25 for break and hold for any lift
44 level holding so far but below 1250,1249,and 1248.25 is not a strength signal
beneath is 1239,
1223.75, and 1215
other levels to note below would be 1235 and 1226
a sharp lift needed to break/pierce even if corrective to exceed 1283
Eyeing 48.25 and 50.25 for break and hold for any lift
44 level holding so far but below 1250,1249,and 1248.25 is not a strength signal
beneath is 1239,
1223.75, and 1215
other levels to note below would be 1235 and 1226
For reference if new
1250 the 62% of years range
1215 the 50%
1223.75 the top of the consoidation of last 3 months
H&S refers to 1st half of year topping pattern
1250 the 62% of years range
1215 the 50%
1223.75 the top of the consoidation of last 3 months
H&S refers to 1st half of year topping pattern
Me have 1244.50 as a 1.36% / 1242.75 as a 1.50% .. MA is @ 1249.00
Originally posted by redsixspeed
Me have 1244.50 as a 1.36% / 1242.75 as a 1.50% .. MA is @ 1249.00
====================================================================
that should be 36% / 50% ... looking ahead when I put those #s ..
for 18.25-70.75 range?
Originally posted by redsixspeed
Originally posted by redsixspeed
Me have 1244.50 as a 1.36% / 1242.75 as a 1.50% .. MA is @ 1249.00
====================================================================
that should be 36% / 50% ... looking ahead when I put those #s ..
No, these came from another calculation .. but when #s from different method end up in the same area that area is stronger ...
Counting Elliot Waves is an art. and I'm not good at it, that's why I say It's a trip, -- a trip for me. -- My hat is off to those that can do that type of sophisticated work.-
Originally posted by sandoxe
No thank you LOL. What a trip! The only reason I'm posting E.W.s is bc they show up in the last few days. I will not want to be labeling every little move, no way! 5 waves and the 4 wave a.b.c..d.e. is as far as I go. - wave 3 momo I like.
Elliot wave is just one of my tools in my trading tool box.-.-.
Originally posted by grednfer
If you're really into EW, you should check out this site.....
http://pretzelcharts.blogspot.com/
I don't trade EW, its too hindsight for me.....just momo....its always right.
Hey Bruce, before you put things to rest .. do you see anything at the 1244.00/1242.25 area tonight
Emini Day Trading /
Daily Notes /
Forecast /
Economic Events /
Search /
Terms and Conditions /
Disclaimer /
Books /
Online Books /
Site Map /
Contact /
Privacy Policy /
Links /
About /
Day Trading Forum /
Investment Calculators /
Pivot Point Calculator /
Market Profile Generator /
Fibonacci Calculator /
Mailing List /
Advertise Here /
Articles /
Financial Terms /
Brokers /
Software /
Holidays /
Stock Split Calendar /
Mortgage Calculator /
Donate
Copyright © 2004-2023, MyPivots. All rights reserved.
Copyright © 2004-2023, MyPivots. All rights reserved.