ES SRs and Fibs 11/16/11
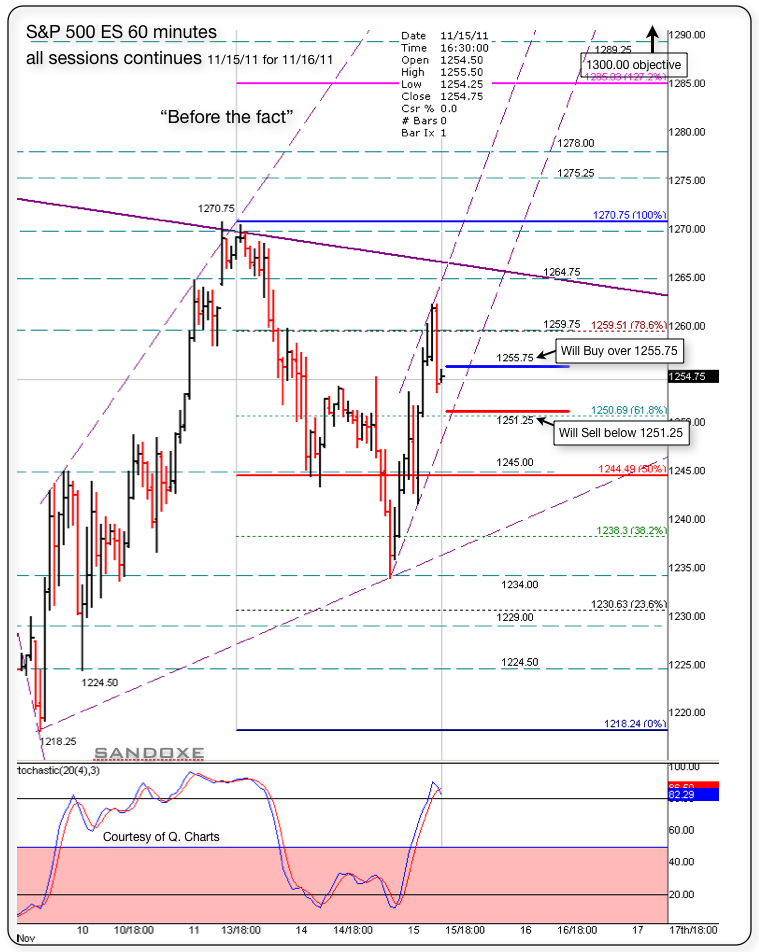
Below is a 60 minutes chart with the S/Rs for night and day traders.
Notice that we have the same set-up as the previous session. Above 1255.75 I will be buying and focusing on uptrend.
if, below 1251.25, I will be selling and focusing on down trend.
The market has the last word and in due time will show us the real deal in dollars and cents.-.
Right now, next hours, next days, next weeks, next months and next years to come, I see for you the same I see for my self: Having the very best of luck, fun, awesome, and incredibly profitable trading experience!!
Click image for original size
Here we go again. its moving to test 1248.00. 1248 is 50% from afternoon's up move. Not shown in my chart. - Next strong support is 1244.50. ,-, 1244.50 is 50% ret. shown in the chart and also 61% ret. from afternoon up move. It's most likely will base there.-. Will see,-,
Nice test! 1244.75!
Now trading 1245.75 21:18
Now trading 1245.75 21:18
Originally posted by sandoxe
Here we go again. its moving to test 1248.00. 1248 is 50% from afternoon's up move. Not shown in my chart. - Next strong support is 1244.50. ,-, 1244.50 is 50% ret. shown in the chart and also 61% ret. from afternoon up move. It's most likely will base there.-. Will see,-,
Test as support failed. Now test as resistance. If the test as resistance fails. Then back up to test 1251.25
If the test to resistance pass then 1240 area is next and possibly 1234
Now trading 1244.25 21:37
If the test to resistance pass then 1240 area is next and possibly 1234
Now trading 1244.25 21:37
1240 area is 78% ret from afternoon up move and small s/r not shown in the chart. The reason I did not put those numbers in the chart is bc it will be too many freaking #s lol
Originally posted by sandoxe
Test as support failed. Now test as resistance. If the test as resistance fails. Then back up to test 1251.25
If the test to resistance pass then 1240 area is next and possibly 1234
Now trading 1244.25 21:37
Here's what I've got for my MAP of PASR ZONES using a 30min chart of 20 days of data coming into Wednesday's trading. The Red lines are potential significant levels with Magenta lines as semi-significant. The Light Blue Volume Proile of the past "rolling" 20 days is displayed on the right vertical axis. The Gray background shows non-RTH price activity. Hope some find this useful!
Click image for original size
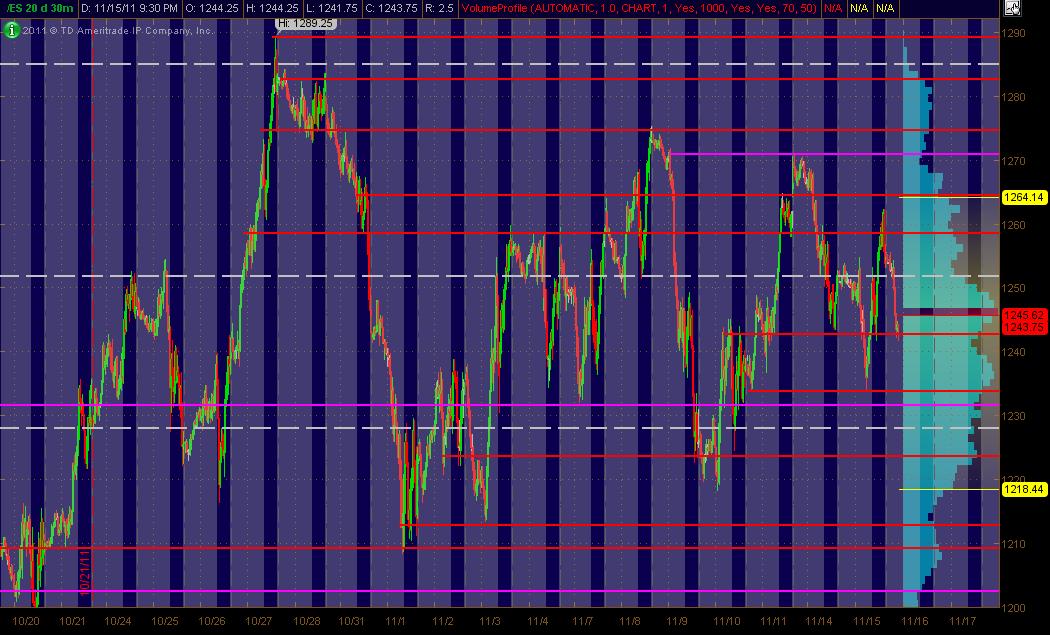
Here are the levels I'm looking at with more description:
1271-74 PASR Zone
1264.50 PASR, Daily R1 using RTH data
1253 VolProf LVN
1242.50 PASR, Daily S1 using RTH data, VolProf LVN on multiple time frames, Fib Retrace Level
1232-31 PASR
1224-23 PASR
1271-74 PASR Zone
1264.50 PASR, Daily R1 using RTH data
1253 VolProf LVN
1242.50 PASR, Daily S1 using RTH data, VolProf LVN on multiple time frames, Fib Retrace Level
1232-31 PASR
1224-23 PASR
in the 11/15 thread me said 1245.25 is key .. this 2:40am et the 5' candle touched it ... the area is 1245.25 up to 1248 00 ..
Currently at 1243.5 with O/N low 1238.25 so far. Can reverse at anytime in this area of congestion. Correction should be held below 1250 area, if not the 44. They're areas and failure to hold negative.
Lost the 57,55,50,49,47,44, and 39. Kind of sliced right through the 48.25,49, and 50 levels. hmmm!
HOD - 36(actually 36.75) adjusted for 62.25
1262.25 - 36.75 = 1225.50 the equidistant move
1262.25 - 25 = 1237.25 the 68
1231 area the mean between.
below 25.50 would be an extension, if it holds
Actually, the 1.68 puts it at right about 1200. The 1215 the 50% level and 1208 a potential reversal point if it gets that low.
Still have to watch out if 1223.75 holds and for spikes, reversal as we're in between all those lower highs and higher lows right here.(We're in between all those lower highs and higher lows right here.)
Reversal upward will have to break all those levels again and hold the 58.50 for higher, imo. Best usually if above 34 holds(higher low).
1244 a key level in this area to keep in mind if looking for higher.
I assume others are like me and can only post a fraction of their analysis at any given time in the rth. I use a lot of combined methods and try to give my overall prevailing thoughts at any given time. Like right here as I watch a dragon pattern forming if that back at 40.50 level keeps a lower high above. Will go higher if unfamiliar.New low above 41, and spike to 43.50 so far as I type.
Point is I don't expect to see my whole thoughts posted at any one time during the day. I also don't expect I'll see others complete analysis posted.(1244.75 now) Just the way it is. I use patterns,candles,indicators,fibs, and a few other things.(45.25 high)
So what others see here is the picture I post. What I see is the movie.
(1245.75 high,mark the time 1 min chart)
"Fix your thoughts on what is true, and honorable, and right, and pure, and lovely, and admirable. Think about things that are excellent and worthy of praise."
(Not a religious message.)
from my post above ... to see what I see ... draw a fib from 1245.25 up to 1248.00 ... now edit the fib to show only 78.6 & 75
that should be 78.6 & 50 ^^ ... need coffee
Originally posted by vasuki
yes actually got tweet from Geithner!!!!!!!!!!!!!!!!!!!!!!!!!
=======================================================================
factory said the banks were at serious risk, they missed reporting the downgrade some how ..
Emini Day Trading /
Daily Notes /
Forecast /
Economic Events /
Search /
Terms and Conditions /
Disclaimer /
Books /
Online Books /
Site Map /
Contact /
Privacy Policy /
Links /
About /
Day Trading Forum /
Investment Calculators /
Pivot Point Calculator /
Market Profile Generator /
Fibonacci Calculator /
Mailing List /
Advertise Here /
Articles /
Financial Terms /
Brokers /
Software /
Holidays /
Stock Split Calendar /
Mortgage Calculator /
Donate
Copyright © 2004-2023, MyPivots. All rights reserved.
Copyright © 2004-2023, MyPivots. All rights reserved.