ES SRs and Fibs 11/16/11
Below is a 60 minutes chart with the S/Rs for night and day traders.
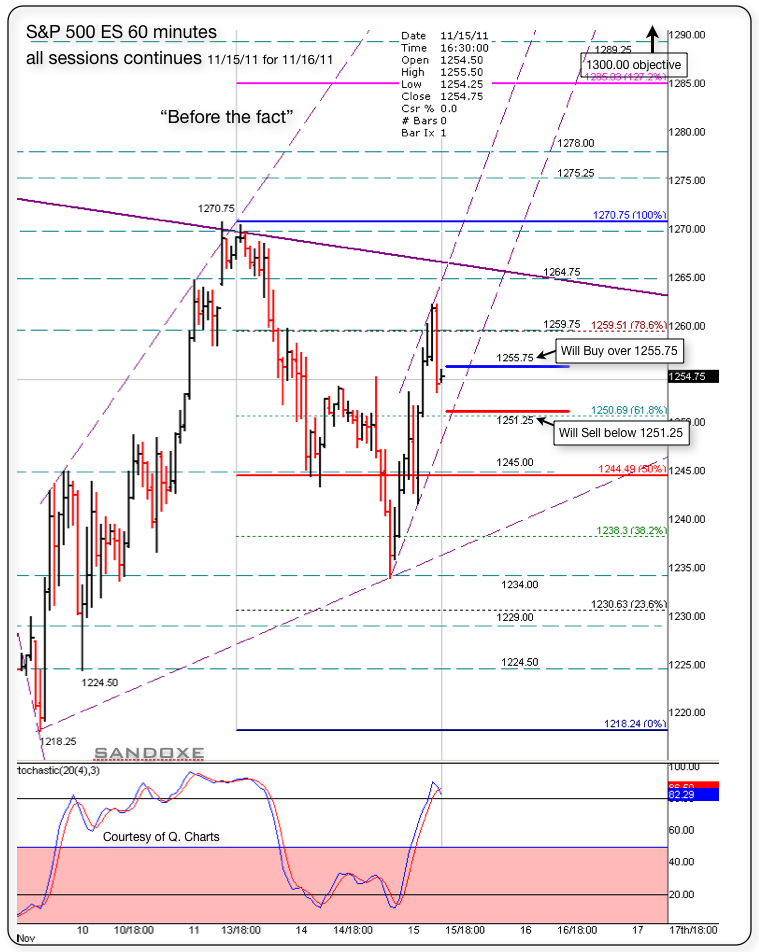
Notice that we have the same set-up as the previous session. Above 1255.75 I will be buying and focusing on uptrend.
if, below 1251.25, I will be selling and focusing on down trend.
The market has the last word and in due time will show us the real deal in dollars and cents.-.
Right now, next hours, next days, next weeks, next months and next years to come, I see for you the same I see for my self: Having the very best of luck, fun, awesome, and incredibly profitable trading experience!!
Click image for original size
My internet was out for some time. Ok, price found support at 1238.25. 1238.25 is 38% shown in the 60m. chart. Price bounced back and now back to test 1244.50 (50%) as resistance. Possible back down to 1238.00 again for support and up from there. (does not need to go all the way down to 1238) I will not be surprise if we open at 1255 in the morning. Will see if 1238 holds.
Now trading 1242.75 03:05
Now trading 1242.75 03:05
Originally posted by redsixspeed
in the 11/15 thread me said 1245.25 is key .. this 2:40am et the 5' candle touched it ... the area is 1245.25 up to 1248 00 ..
========================================================================
the boyz across the pond made short work out'a that area .. top of the area 1248.00 acting as support for now ...
The way is moving, possibly a test of 1262 before the open.
Now trading 1251.00 03:42
Now trading 1251.00 03:42
Originally posted by sandoxe
My internet was out for some time. Ok, price found support at 1238.25. 1238.25 is 38% shown in the 60m. chart. Price bounced back and now back to test 1244.50 (50%) as resistance. Possible back down to 1238.00 again for support and up from there. (does not need to go all the way down to 1238) I will not be surprise if we open at 1255 in the morning. Will see if 1238 holds.
Now trading 1242.75 03:05
If you where to look at a 10m chart stochastic you will notice that's in overbought condition. Some times the price will move sideways for a bit to release some of that condition. In this case, price is moving down testing 1251/50 area as support. Now, look at a 2 minute stochastic, is in oversold now and the price is zigzagging at a support area. once the 2 minute stochastic starts to turn and moving out the oversold, -.- will be bc price is moving up and away from support to next resistance.
Now trading 1252.00 04:30
Now trading 1252.00 04:30
Other times the stochastic starts to move up but the price is not moving much, the stochastic gets to overbought but the price is not moving too much. That, is bearish or top!
Originally posted by sandoxe
If you where to look at a 10m chart stochastic you will notice that's in overbought condition. Some times the price will move sideways for a bit to release some of that condition. In this case, price is moving down testing 1251/50 area as support. Now, look at a 2 minute stochastic, is in oversold now and the price is zigzagging at a support area. once the 2 minute stochastic starts to turn and moving out the oversold, -.- will be bc price is moving up and away from support to next resistance.
Now trading 1252.00 04:30
Originally posted by sandoxe
Other times the stochastic starts to move up but the price is not moving much, the stochastic goes to overbought but the price is not moving too much. That, is bearish or top!Originally posted by sandoxe
If you where to look at a 10m chart stochastic you will notice that's in overbought condition. Some times the price will move sideways for a bit to release some of that condition. In this case, price is moving down testing 1251/50 area as support. Now, look at a 2 minute stochastic, is in oversold now and the price is zigzagging at a support area. once the 2 minute stochastic starts to turn and moving out the oversold, -.- will be bc price is moving up and away from support to next resistance.
Now trading 1252.00 04:30
Is that the 2 minute or 10 minute Sandoxe??
2 minute. Brent.T
Something to always keep in mine is when the 2,10,60 are on oversold at support, it is explosive to the outside. The reverse applies when price is at resistance.
Something to always keep in mine is when the 2,10,60 are on oversold at support, it is explosive to the outside. The reverse applies when price is at resistance.
sorry meant "mind" not mine lol
There it goes.1259 next resistance (78%) then 1262.
Now trading 1257.25 05:01
Now trading 1257.25 05:01
Originally posted by vasuki
yes actually got tweet from Geithner!!!!!!!!!!!!!!!!!!!!!!!!!
=======================================================================
factory said the banks were at serious risk, they missed reporting the downgrade some how ..
Emini Day Trading /
Daily Notes /
Forecast /
Economic Events /
Search /
Terms and Conditions /
Disclaimer /
Books /
Online Books /
Site Map /
Contact /
Privacy Policy /
Links /
About /
Day Trading Forum /
Investment Calculators /
Pivot Point Calculator /
Market Profile Generator /
Fibonacci Calculator /
Mailing List /
Advertise Here /
Articles /
Financial Terms /
Brokers /
Software /
Holidays /
Stock Split Calendar /
Mortgage Calculator /
Donate
Copyright © 2004-2023, MyPivots. All rights reserved.
Copyright © 2004-2023, MyPivots. All rights reserved.