The Fib Grid
Here is my master chart which has evolved out of my "Ratchet" concept I have mentioned on the day trading threads. With these levels you will never again need to measure moves, run fibs or dare I say possibly even draw market profile numbers on your charts. Ok, perhaps that is all a bit extreme but these levels will never change and work great on the stock index markets.
I've notice over a great many years that the market respects certain levels of prices. The basic ones are the numbers ending in "00", "50" and "75". What I have done is add in some key numbers that Lewis Borsellino used. These where the percentage retracement numbers of 12.50, 25 ,33, 50, 66, 75 and 88 percent numbers but in one interview ( I'll be damned if I can find it) he implied additional uses of the numbers. Sorry Jim Kane and Roofer but Lewis was the first one to make the 88% numbers available to me. Perhaps he stole it from you back in 1996!
For me the additional twist comes when you add in fib numbers....not the actually levels....this requires no measuring or deciding where to snap fib lines. We are only concerned with the fib numbers themselves. The missing ingredient comes with use the 6.25 point ratchets to fill in the gaps in the missing areas. We are basically having a key number at every 6.25 points with a few exceptions and greater emphasis in the confluence zones.
As usual the entries will come down to an understanding of price action and/or order flow. Closes on the 15 minute time frame after 10 a.m. Eastern time shows promise but I don't "do" system trades. Lets put the numbers down here first before we look at a few charts.
00 - the basis of it all and key rat
06.25 Ratchet number
12.50 - 1/8th
18.75 -rat
23.5 - Fib number
25 - key Rat 1/4
33 - 1/3
38 -Fib
43.75 - rat
50 fib - not officially - 1/2 key level not labelled on my chart
56.25 -Rat
62- fib
66- 2/3
70 -Fib
75-key rat 3/4
78 -fib
88-fib
93.75-rat
100
There they are. All the numbers you will ever need for the ES. It doesn't matter if we are at 1200 or 100 in the S&P we just use the last few digits....so we could be using 138 or 1238 for example of the 38 number...no snapping lines required.
Are these perfect? No,but what method or level actually is ? Numbers will hit over time..all numbers and all levels...posting numbers is the easy part but it does help others in being able to spot areas to potentially take trades from. These levels are best used in conjunction with your current methods. I use them with the market profile and the low volume numbers.
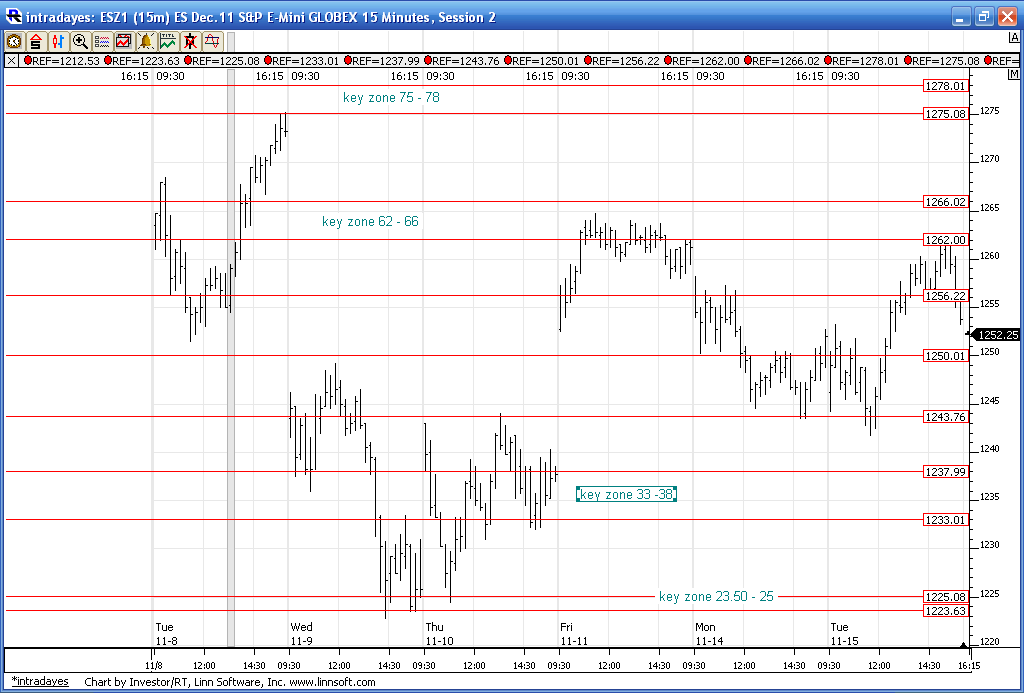
Here is a chart from the last week. You will notice how the clusters of numbers work very well at pointing out tops and bottoms. Those clusters are the 62 - 66 zone, the 23.50 - 25 zone and the 75 - 78 zone.
I've notice over a great many years that the market respects certain levels of prices. The basic ones are the numbers ending in "00", "50" and "75". What I have done is add in some key numbers that Lewis Borsellino used. These where the percentage retracement numbers of 12.50, 25 ,33, 50, 66, 75 and 88 percent numbers but in one interview ( I'll be damned if I can find it) he implied additional uses of the numbers. Sorry Jim Kane and Roofer but Lewis was the first one to make the 88% numbers available to me. Perhaps he stole it from you back in 1996!
For me the additional twist comes when you add in fib numbers....not the actually levels....this requires no measuring or deciding where to snap fib lines. We are only concerned with the fib numbers themselves. The missing ingredient comes with use the 6.25 point ratchets to fill in the gaps in the missing areas. We are basically having a key number at every 6.25 points with a few exceptions and greater emphasis in the confluence zones.
As usual the entries will come down to an understanding of price action and/or order flow. Closes on the 15 minute time frame after 10 a.m. Eastern time shows promise but I don't "do" system trades. Lets put the numbers down here first before we look at a few charts.
00 - the basis of it all and key rat
06.25 Ratchet number
12.50 - 1/8th
18.75 -rat
23.5 - Fib number
25 - key Rat 1/4
33 - 1/3
38 -Fib
43.75 - rat
50 fib - not officially - 1/2 key level not labelled on my chart
56.25 -Rat
62- fib
66- 2/3
70 -Fib
75-key rat 3/4
78 -fib
88-fib
93.75-rat
100
There they are. All the numbers you will ever need for the ES. It doesn't matter if we are at 1200 or 100 in the S&P we just use the last few digits....so we could be using 138 or 1238 for example of the 38 number...no snapping lines required.
Are these perfect? No,but what method or level actually is ? Numbers will hit over time..all numbers and all levels...posting numbers is the easy part but it does help others in being able to spot areas to potentially take trades from. These levels are best used in conjunction with your current methods. I use them with the market profile and the low volume numbers.
Here is a chart from the last week. You will notice how the clusters of numbers work very well at pointing out tops and bottoms. Those clusters are the 62 - 66 zone, the 23.50 - 25 zone and the 75 - 78 zone.
Click image for original size
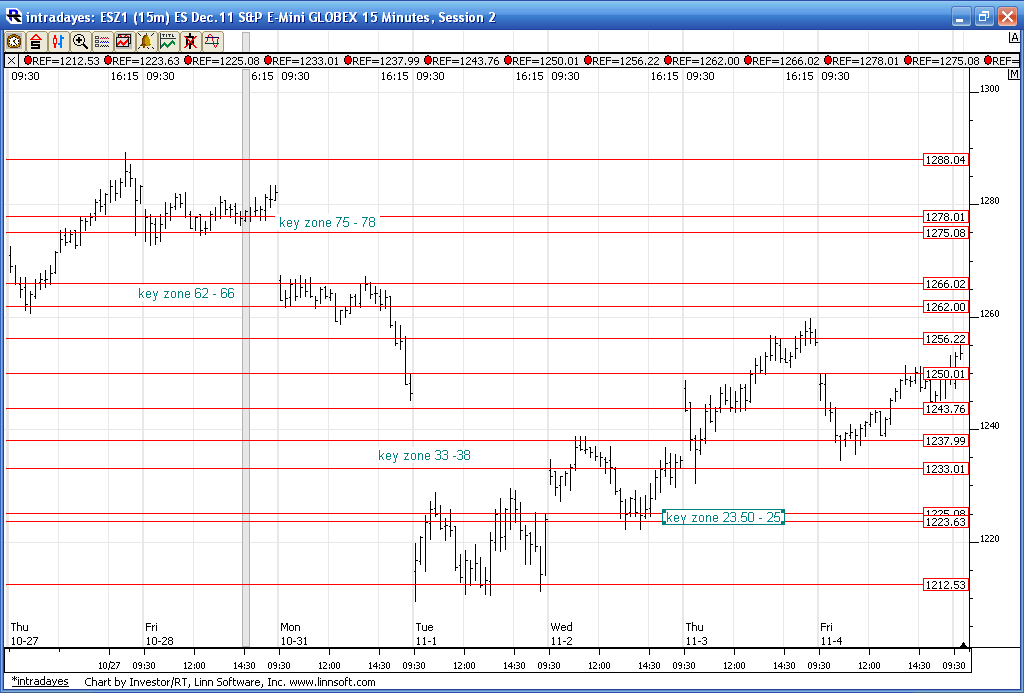
here is from two weeks back.....
Click image for original size
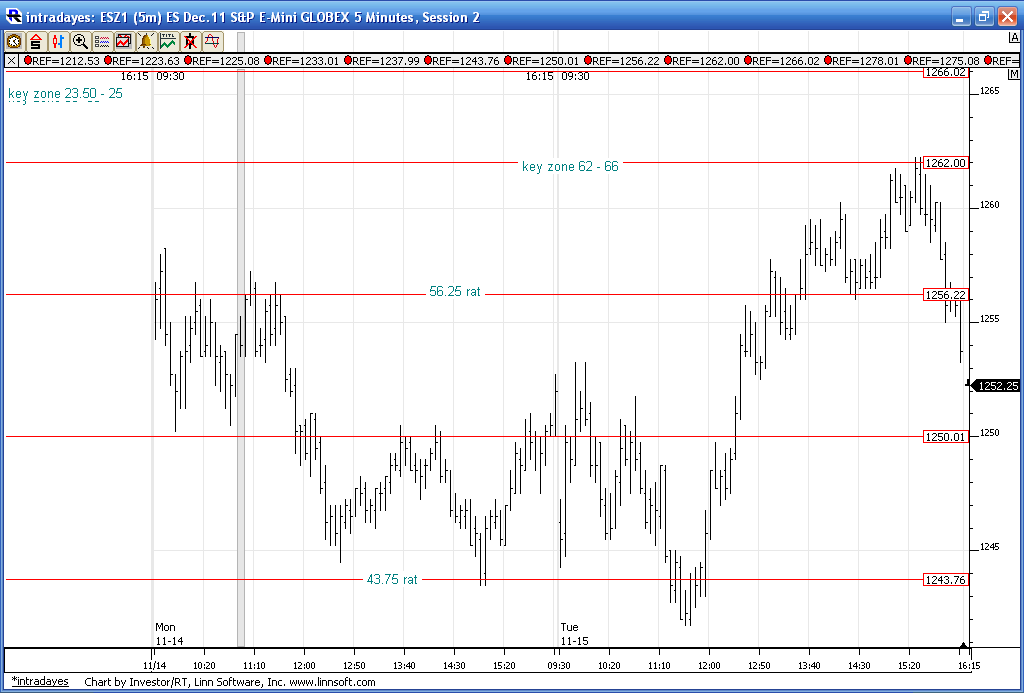
here is the last two days...
Click image for original size
I think most of us are guilty of making trading out to be over complicated. We try to be patient while we wait for a trade so we feel compelled to snap lines all over the place and mess with every freaking indicator our software provides. Been there and done that !I guess we just get bored and feel like we need to get our moneys worth from our software.
Most won't use these master levels. They aren't "sexy" enough and complex enough to warrant the inclusion to ones trading arsenal.People need to justify their time. Most would be better off focusing on reading order flow at key price zones. If I could go back in time this is where I would put my focus.
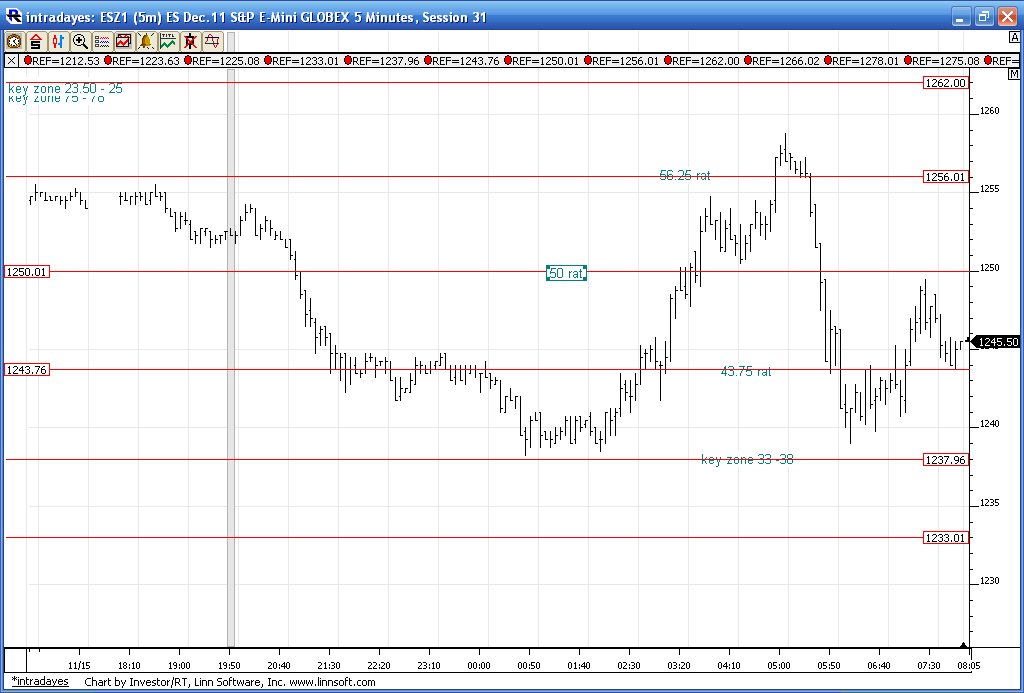
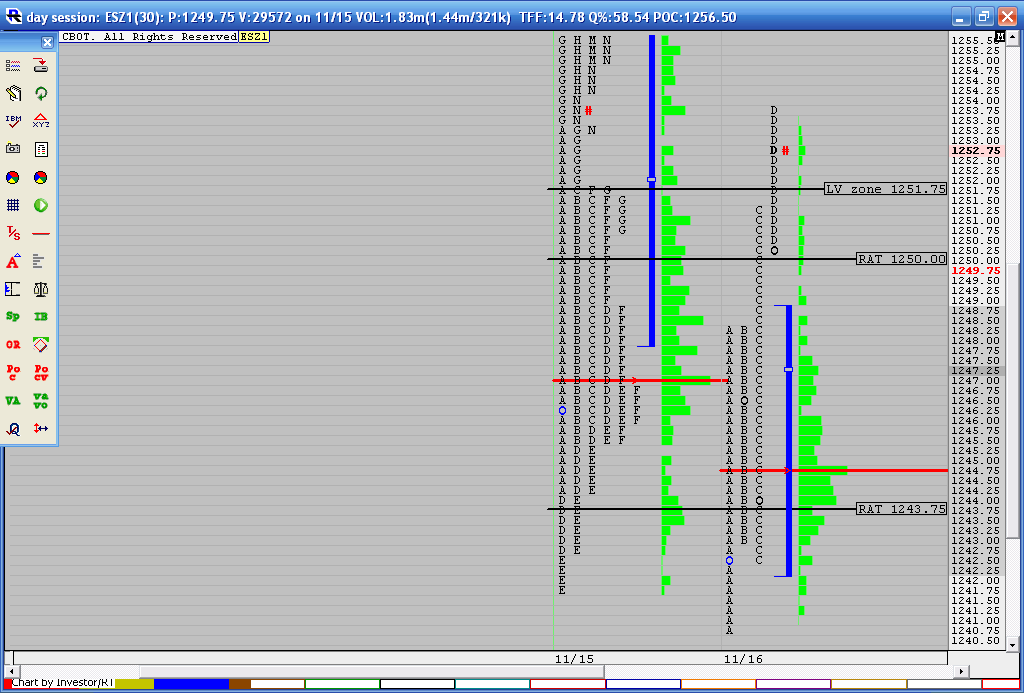
Yesterdays day session had a time POC at 56.50, a low volume area at 51 and the days low at 41.50. So we will have three Rat levels that line up with those to watch in the day session. The current overnight low is 38.25...hey that is a rat zone too.
Here is a chart of how the overnight respected the levels so far.
Most won't use these master levels. They aren't "sexy" enough and complex enough to warrant the inclusion to ones trading arsenal.People need to justify their time. Most would be better off focusing on reading order flow at key price zones. If I could go back in time this is where I would put my focus.
Yesterdays day session had a time POC at 56.50, a low volume area at 51 and the days low at 41.50. So we will have three Rat levels that line up with those to watch in the day session. The current overnight low is 38.25...hey that is a rat zone too.
Here is a chart of how the overnight respected the levels so far.
Click image for original size
Bruce, thank you very very much for your time and your dedication. It is a very important help for my this kind of material.
Thanks for the grid Bruce .. How would I use this
Here is an example:
At 8:50pm et I had a projection to the downside @ 1239.50
once I get the projection I look for confirming #s ...
the grid has 1238.00 in that area .. thats one confirmation
but I look for as many as I can find .. LOL
The calculation is #1 all other #s are for confirmation .. in other words .. the calculation filters the #s cuz I am looking for the high % reversal areas ...
The grid is a great tool .. just build a strategy around it
I think it was KoolBlue who said " the projection #s tend to become a reverse area" .. by reverse I mean short term reverse most of the time back to where the projection was made ... a break of the area from where the projection was first made would yield an area to the upside and I would start the process of confirming .. case in point the "rat" from yesterday
Thanks for using white background for the charts.
I started using white background charts years ago, ya know why? because I keep a trading diary and I stick charts in the diary to illustrate conditions (and can opt to show all my trades automatically)
I stopped using dark backround charts, TOO much ink when I printed dark background charts. For a while I kept dark background charts and traded from them, but ultimately I just converted everything to white background.
Thanks red...interesting that the big POC as per time and the overnight is 43.75 on the nose !
well come home
Big B
Big B
attempting shorts now up at 51...chart will follow...not planning on making this a trade posting thread
Originally posted by BruceM
[/b]
Yesterdays day session had a time POC at 56.50, a low volume area at 51 and the days low at 41.50. So we will have three Rat levels that line up with those to watch in the day session. The current overnight low is 38.25...hey that is a rat zone too.
Trying new sells at 53.50...I'm just not sharp yet today....
I prefer to use the rats as targets when other numbers are near by...Today we had nice sells just above the peak volume of yesterday into the 48 area which was the Value area low from yesterday also which came back to 43.75. This secondary sell now I feel is a better sell area as it is LOW volume from yesterday...to target the 1250 Rat or air pockets....when wrong then they will push it to the next area...which would be the 56.25 Rat..
Click image for original size
Sorry this is a bit off topic but was wondering if anyone is using X-Trader DOM? If so do you know how to display 10 levels of depth vs the standard 5? Thanks
Emini Day Trading /
Daily Notes /
Forecast /
Economic Events /
Search /
Terms and Conditions /
Disclaimer /
Books /
Online Books /
Site Map /
Contact /
Privacy Policy /
Links /
About /
Day Trading Forum /
Investment Calculators /
Pivot Point Calculator /
Market Profile Generator /
Fibonacci Calculator /
Mailing List /
Advertise Here /
Articles /
Financial Terms /
Brokers /
Software /
Holidays /
Stock Split Calendar /
Mortgage Calculator /
Donate
Copyright © 2004-2023, MyPivots. All rights reserved.
Copyright © 2004-2023, MyPivots. All rights reserved.