ES Tuesday 11-22-11
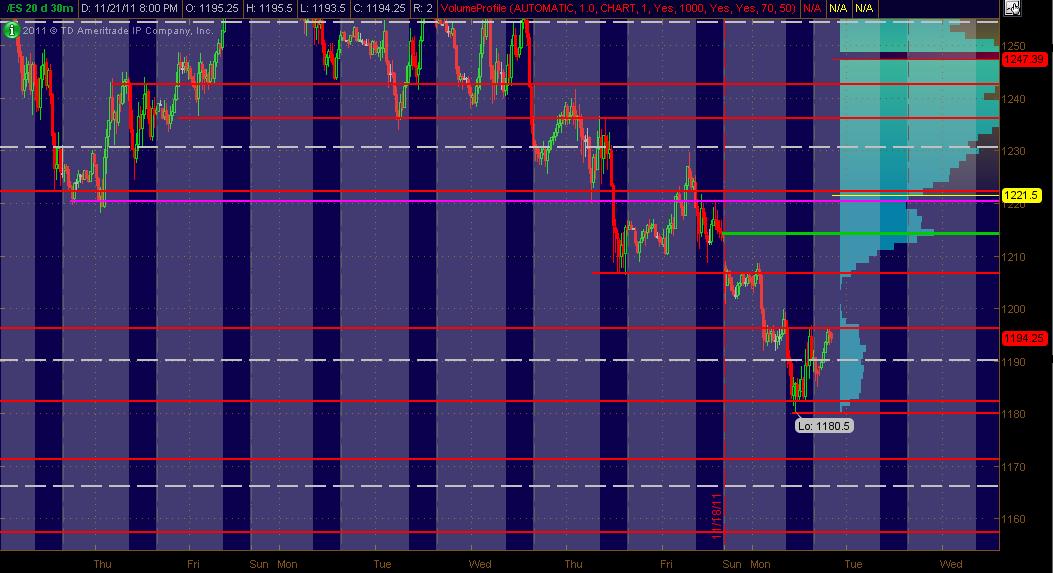
Here's what I've got for my ES MAP of PASR ZONES using a 30min chart of 20 days of data coming into Tuesday's trading. The Red lines are potential significant levels with Magenta lines as semi-significant. The White dashed lines are the Weekly Pivots and the Green line is a Gap to be closed. The Light Blue Volume Profile of the past "rolling" 20 days is displayed on the right vertical axis. The Gray background shows non-RTH price activity. Hope some find this useful!
1214 Gap Close level / 20day & 2day HVN / Fib Cluster
1206 PASR / Daily R2 (RTH calc's) / Fib Cluster
1182 - 1180 PASR / Daily S1 (RTH calc's) / Fib Cluster
1172 - 1171 PASR / Daily S2 (RTH calc's) / DeMark Daily S1
Click image for original size
1214 Gap Close level / 20day & 2day HVN / Fib Cluster
1206 PASR / Daily R2 (RTH calc's) / Fib Cluster
1182 - 1180 PASR / Daily S1 (RTH calc's) / Fib Cluster
1172 - 1171 PASR / Daily S2 (RTH calc's) / DeMark Daily S1
How about that volume gap? Think they wanna close that?
I think the 1 hour and 4hour picture shows a good LT down trend. Could get nasty fast.
1180 is the weekly 200 for ES and almost exactly 1 vix deviation....
1214 Friday's close
-32 Friday's VIX
=1182.
Last week it was 2...looking for a retrace....
I think the 1 hour and 4hour picture shows a good LT down trend. Could get nasty fast.
1180 is the weekly 200 for ES and almost exactly 1 vix deviation....
1214 Friday's close
-32 Friday's VIX
=1182.
Last week it was 2...looking for a retrace....
looking at the 60 minute chart, 1200 looks like a key bull/bear level to me
above 1200, the HVN at 1214 on MM's chart looks like the most obvious obvious focal point for bulls
above 1200, the HVN at 1214 on MM's chart looks like the most obvious obvious focal point for bulls
I'm using the low volume area of 86.50 - 88 and then the upper area of low volume and high volume from day and overnight session at 93.75 - 95...
I'll be watching yesterdays lows but more important is the 75 - 78 zone
I'll be watching yesterdays lows but more important is the 75 - 78 zone
revising my first support zone to 84 - 86...that includes O/N low and peak volume price from yesterday...
buy low and sell high untill we SUSTAIN trade outside of the overnight high or yesterdays day session lows..
buy low and sell high untill we SUSTAIN trade outside of the overnight high or yesterdays day session lows..
Two ideas I use to begin to define SUSTAINABLE trade - 30 minute closes above/below key swing points and a timed limit of 15 minutes.
The air pocket just filled after our key upper zone stopped the rally....old stuff for most now!!
The air pocket just filled after our key upper zone stopped the rally....old stuff for most now!!
We have GAP down at the 71 area
longs want to see a 30 minute close above those single prints that were just filled in and to see the 84 - 86 become a support zone now.......a good sign that they couldn't close it below yesterdays RTH lows for bulls.
Two day volume looks like it wants to create a bigger bell so I'm not anticipating any great trending action yet..
Two day volume looks like it wants to create a bigger bell so I'm not anticipating any great trending action yet..
bruce can you plz post your MP chart?
sorry Scott but i won't be able to get to it now....would later be ok ? perhaps Lisa is around for us.....
Originally posted by scottrigg1
bruce can you plz post your MP chart?
fomc mints got released at 1.30 pm by mistake
I am new in the this room, only from some months ago. Bruce, I apreciate a lot your concepts, ideas and more the everything your explanations about MP and volumen, something that I am realizing works very well and for me it is different of all the concepts that I learned until now. Thanks everybody for share your knowledge.
Emini Day Trading /
Daily Notes /
Forecast /
Economic Events /
Search /
Terms and Conditions /
Disclaimer /
Books /
Online Books /
Site Map /
Contact /
Privacy Policy /
Links /
About /
Day Trading Forum /
Investment Calculators /
Pivot Point Calculator /
Market Profile Generator /
Fibonacci Calculator /
Mailing List /
Advertise Here /
Articles /
Financial Terms /
Brokers /
Software /
Holidays /
Stock Split Calendar /
Mortgage Calculator /
Donate
Copyright © 2004-2023, MyPivots. All rights reserved.
Copyright © 2004-2023, MyPivots. All rights reserved.