ES Monday 11-28-11
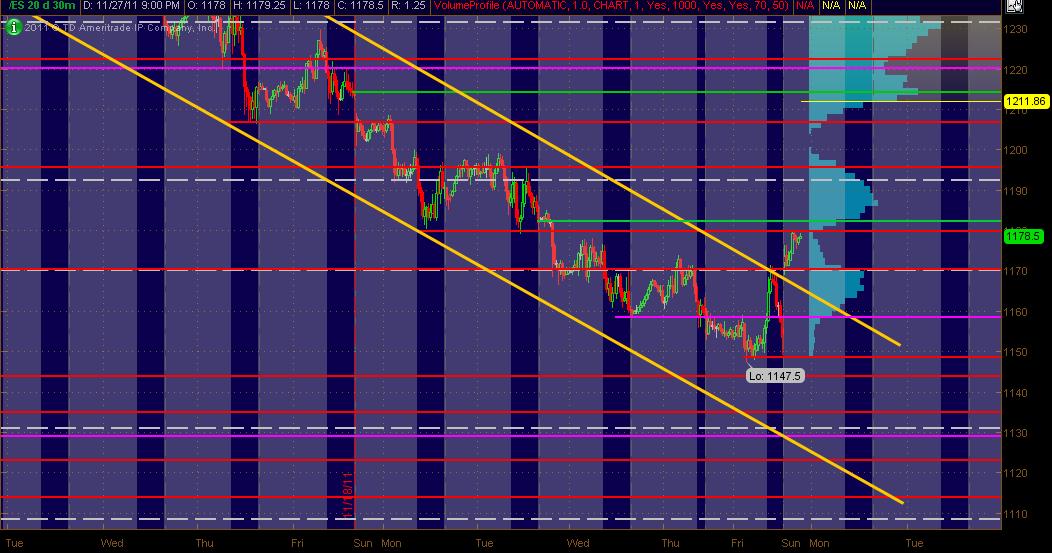
Here's what I've got for my ES MAP of PASR ZONES using a 30min chart of 20 days of data coming into Monday's trading. The Red lines are potential significant levels with Magenta lines as semi-significant. The White dashed lines are the Weekly Pivots and the Green lines are Gaps to be closed. The Light Blue Volume Profile of the past "rolling" 20 days is displayed on the right vertical axis. The Gray background shows non-RTH price activity. I've also got a downward sloping trendline (channel) in drawn in Yellow. Hope this is helpful to some as a "MAP"
Drew this all in on Saturday ... overnight mkt has traded up into a Red PASR line/zone around 1179-80 fwiw ... reacted back down and currently trading at 1175.
Click image for original size
Drew this all in on Saturday ... overnight mkt has traded up into a Red PASR line/zone around 1179-80 fwiw ... reacted back down and currently trading at 1175.
MM on your chart there is a peak volume just below 1190, what price level is that on your chart ?
Looking at today's Daily Notes for the ES, 1190.00 = 0.618 extension of Friday's range.
Looking at today's Daily Notes for the ES, 1190.00 = 0.618 extension of Friday's range.
I pull back to the 8 to 85 maybe a long
bruce your not in here today hard to find trade up 40 points
Hey PT, apologize for tardy response. It's 1187 on my TOS platform.
Originally posted by pt_emini
MM on your chart there is a peak volume just below 1190, what price level is that on your chart ?
Looking at today's Daily Notes for the ES, 1190.00 = 0.618 extension of Friday's range.
where here at the rat
I think a move back up to 92 witch is a wall could fail and bring us back down
im also going back to 11/21/ and 11/22 also 93.75 is a RAT
Emini Day Trading /
Daily Notes /
Forecast /
Economic Events /
Search /
Terms and Conditions /
Disclaimer /
Books /
Online Books /
Site Map /
Contact /
Privacy Policy /
Links /
About /
Day Trading Forum /
Investment Calculators /
Pivot Point Calculator /
Market Profile Generator /
Fibonacci Calculator /
Mailing List /
Advertise Here /
Articles /
Financial Terms /
Brokers /
Software /
Holidays /
Stock Split Calendar /
Mortgage Calculator /
Donate
Copyright © 2004-2023, MyPivots. All rights reserved.
Copyright © 2004-2023, MyPivots. All rights reserved.