ES Friday 12-16-11
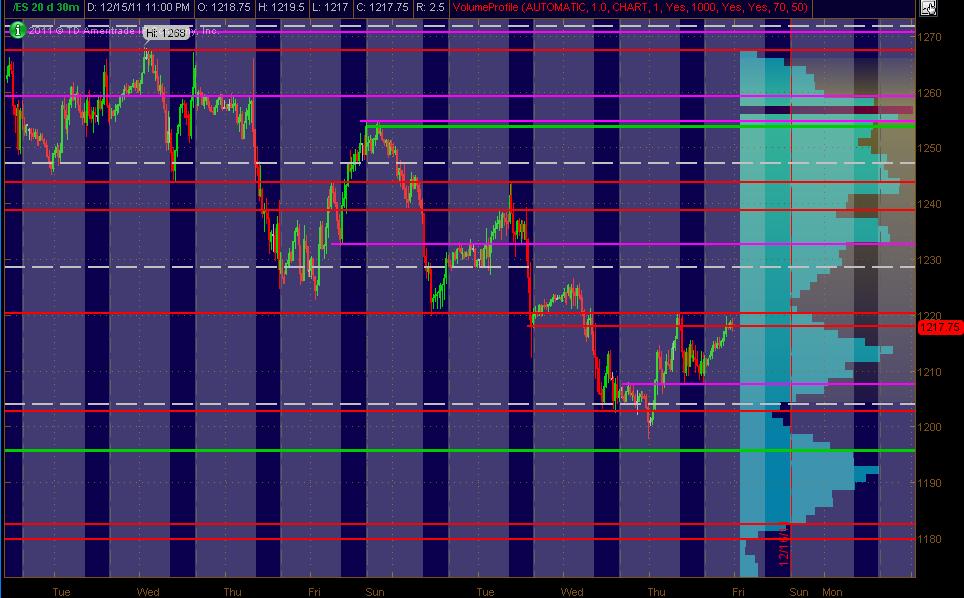
Here's what I've got for my ES MAP of PASR ZONES using a 30min chart of 20 days of data coming into Friday's trading. The Red lines are potential significant levels with Magenta lines as semi-significant. The White dashed lines are the Weekly Pivots. The Green line(s) is an unclosed gap level. The Light Blue Volume Profile of the past "rolling" 20 days is displayed on the right vertical axis. The Gray background shows non-RTH price activity. Hope, as always, that this is helpful to some as a "MAP."
Don't forget it's Crazy Friday Witching Day ... lots of atypical crosscurrents.
As for levels above and below current trading as of the post:
1233 Fib cluster / Minor PASR / Daily R2
1229 Wkly Pvt / Minor PASR
1218-20 PASR / Trendline down on 30m chart
1207 Minor PASR / Fib Rtc / 1 to 2 Day VolProf LVN
1202-04 Wkly Pvt / PASR / 20day VolProf Low Volume Area
Don't forget it's Crazy Friday Witching Day ... lots of atypical crosscurrents.
Click image for original size
As for levels above and below current trading as of the post:
1233 Fib cluster / Minor PASR / Daily R2
1229 Wkly Pvt / Minor PASR
1218-20 PASR / Trendline down on 30m chart
1207 Minor PASR / Fib Rtc / 1 to 2 Day VolProf LVN
1202-04 Wkly Pvt / PASR / 20day VolProf Low Volume Area
bruce why did you finally decide to go for it at 10.5 bruce? i thought you were waiting for 6.5 or lower or staying aside, what made you change your mind if u don't mind ? thanks !
Originally posted by BruceM
agressive longs on 10.50
Singles (LVN) at 1215.75
Nick..I was watching to see how that last 30 minute bar was going to close...so I was anticipating that 3rd single print....so I "KNEW" ( as best as I could) from a probability standpoint that they would go back up to fill in at least one of those single prints......I also had the 09 as a support area and we were above that and I saw $Tick diverging...so it was an anticipation trade...this is also a bad time for trends and we know the market alternates between trends and consolidation..so we were overdue.....my footprints were showing subtle signs too...so I pulled the trigger long...
not the most precise and I knew it was agressive in general....sorry if that expalination didn't help much
not the most precise and I knew it was agressive in general....sorry if that expalination didn't help much
thanks bruce , enjoy the weekend
Emini Day Trading /
Daily Notes /
Forecast /
Economic Events /
Search /
Terms and Conditions /
Disclaimer /
Books /
Online Books /
Site Map /
Contact /
Privacy Policy /
Links /
About /
Day Trading Forum /
Investment Calculators /
Pivot Point Calculator /
Market Profile Generator /
Fibonacci Calculator /
Mailing List /
Advertise Here /
Articles /
Financial Terms /
Brokers /
Software /
Holidays /
Stock Split Calendar /
Mortgage Calculator /
Donate
Copyright © 2004-2023, MyPivots. All rights reserved.
Copyright © 2004-2023, MyPivots. All rights reserved.