ES Friday 1-6-12
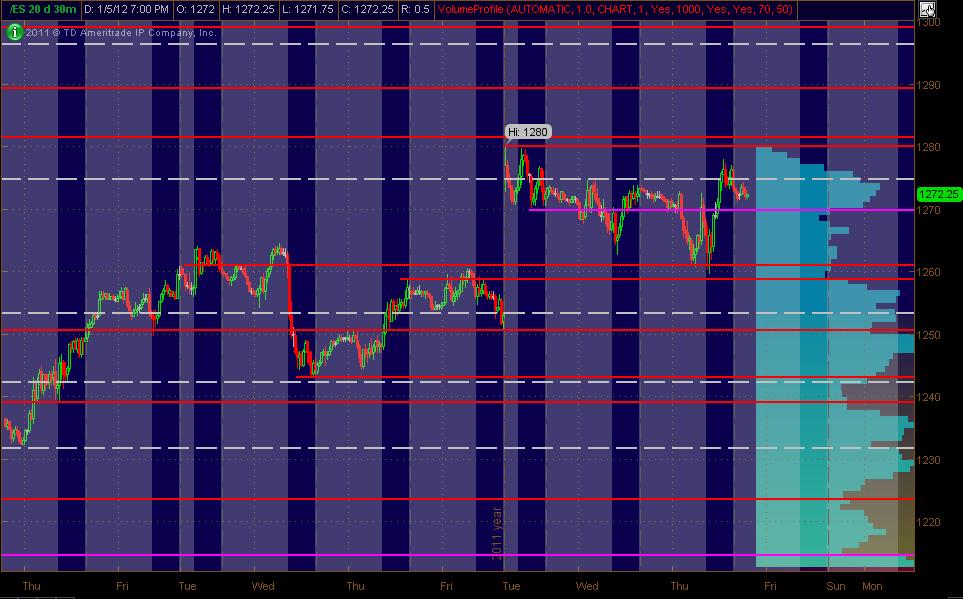
Here's what I've got for my ES MAP of PASR ZONES using a 30min chart of 20 days of data coming into Friday's trading. The Red lines are potential significant levels with Magenta lines as semi-significant. The White dashed lines are the Weekly Pivots. The Light Blue Volume Profile of the past "rolling" 20 days is displayed on the right vertical axis. The Gray background shows non-RTH price activity. Hope, as always, that this is helpful to some as a "MAP."
Btw, a couple of price lines are very near each other in price ... and should be considered ZONES between them.
Ps. (un)employment report comes out early in the morn' ... so thangs could be a bit whacky
Click image for original size
Btw, a couple of price lines are very near each other in price ... and should be considered ZONES between them.
Ps. (un)employment report comes out early in the morn' ... so thangs could be a bit whacky
Looking at 1 and 2 day VolProf ... along with Daily and Wkly calculated Pivots ... and what I'm seeing as PASR levels ... not much "confluence" ... in other words kinda messy to me.
The key price ZONES I'm seeing for now are 1260 and 1280 to work off of as attractors and/or halting areas for price.
The key price ZONES I'm seeing for now are 1260 and 1280 to work off of as attractors and/or halting areas for price.
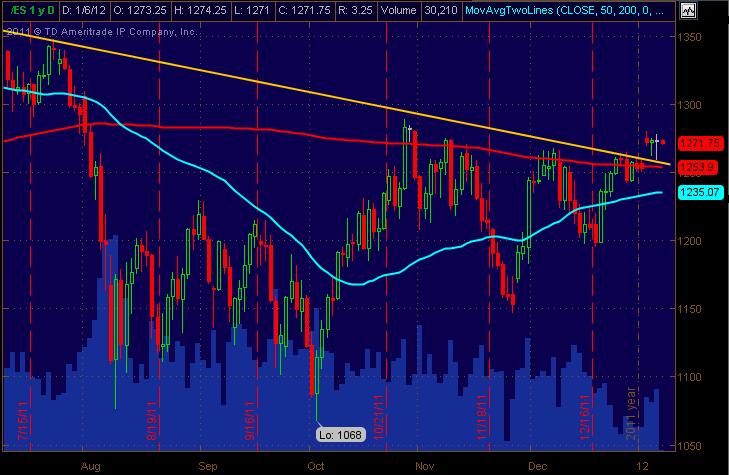
And not to get lost from the bigger picture, here's the ES Daily with a 50 and 200 SMA along with a Yellow downtrend line. The 200sma and downtrend line (that the ES has broken out ABOVE) are currently at the 1254-56 area as of today ... potential support (and also are key things a lotta folks ... including bigger money folks take into account in some fashion). Showing support so far after the upward daily breakout on the chart. Just a little more big-pic info that most already have on their own screens here.
Click image for original size
Thanks MM. Our last charts are identical. The nice ascending triangle is shaping up as well.
using 81 - 83 as initial resistance then up at 87.50 - 88.......76.25 is a big magnet...so sells up here 4 me
Tuesdays highs and October highs are the reason I'm using that first upper zone...Della mentioned that the other day.....76.25 is PVP price from Thursday and was O/N high before report hit.
Unfilled gap from back in june or july and we have r2 at 88.50 so that is upper zone for me..
Yearly open at 73.50 and POC from O/N sits at 73....this is biggest hurdle for any selling today....
Single print breakout point from day session yesterday matches O/N lows.....so 64 - 67.50 will beome a bigger support zone as we move forward to keep track of...this is the peak volume of the bell curve and the low volume
my basic plan for mechanical traders ala pitbull...if we open and rally 2.50 points up I would sell the open print ( most agressive) ..reverse this concept for sells but I should caution that these breakout trades are most agressive
...prefered trades will add or subtract 4 and 5.5 points off the open print and see what matches up with key numbers like the 73 area or up near Overnight highs for fades....see pitbull thread for how "Harvie" would have done it or ask me here if interested..
...prefered trades will add or subtract 4 and 5.5 points off the open print and see what matches up with key numbers like the 73 area or up near Overnight highs for fades....see pitbull thread for how "Harvie" would have done it or ask me here if interested..
watching the pit bull trade at the open Bruce. thanks.
77.50 is open print so will look for buys under 73.75 and sells up near above 81...but if we stall at 75 and come back up to open print then the agressive traders will buy.....
flat at 72.75....too close to yearly open to hold for air fill
bruce on your footprint you use 5 min or 30 min
Emini Day Trading /
Daily Notes /
Forecast /
Economic Events /
Search /
Terms and Conditions /
Disclaimer /
Books /
Online Books /
Site Map /
Contact /
Privacy Policy /
Links /
About /
Day Trading Forum /
Investment Calculators /
Pivot Point Calculator /
Market Profile Generator /
Fibonacci Calculator /
Mailing List /
Advertise Here /
Articles /
Financial Terms /
Brokers /
Software /
Holidays /
Stock Split Calendar /
Mortgage Calculator /
Donate
Copyright © 2004-2023, MyPivots. All rights reserved.
Copyright © 2004-2023, MyPivots. All rights reserved.