Question about volume
In trading the e-mini S&P, I sometimes notice a huge increase in the sitting buy and sell orders. Typically, orders at any level (close to the current price) range from 100 to 1200. I know that's a wide range. But what I'm wondering about is when I'm seeing 2000-4000 at each level.
Order levels often spike on the opening and at the end of the trading day. I get that.
What I'm asking about is why do levels jump at seemingly random times during the day. Today, I saw this at 2:40 EST.
Volume for 2:38 was 396,
2;39 - 1837,
2:40 - 2755,
2:41 - 3941,
2:42 - 5502,
2:43 - 9192
All in all, the market rallied 1.5 point. A few minutes later, it was back down 1.5 points.
It was like there was this big battle.... and then it was over... basically a draw.
Can anyone shed some light on this? The cause? Or more importantly, what to do? Step aside? Tighten stops?
Yes i noticed that as well.
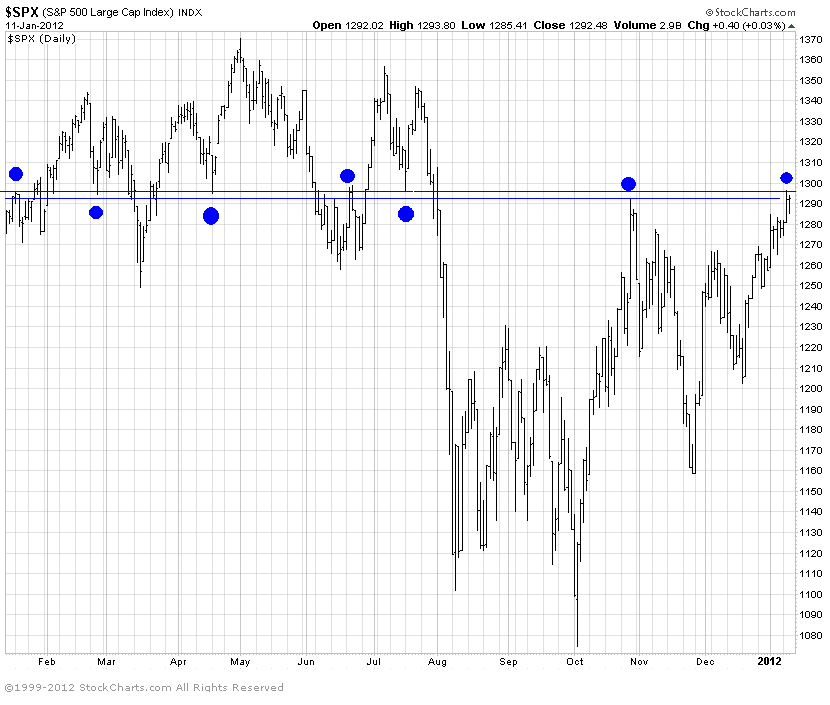
Basically what happened today was price was testing long term resistance (from the daily / weekly time frame charts). I have seen this same effect many times in the past, the order book all of a sudden fills up at an important price level causing the market to stall. (Note: I am not talking about a daily R1 level or something like that, it is usually a key long term level, like the 200 day moving average).
Also, at that time there was a lot of anticipation of shorter term traders of a range expansion above the IB High. If you look at a 30 minute chart you will see a series of 6 higher lows very slowly pressing the market into the IB high. The 3 hour anticipation of a range expansion (the ES range at the time was 6.75 points) filled up the bid side as price moved to the IB high, but at the same time the key resistance level filled up the offer side.
The problem today was, there was no sustained order flow across the tape (Time and Sales) to balance out the order book depth, especially above 1287. So we ended up with a "Mexican standoff at high noon" if you will. The unusual order book depth reflected the anticipation that something big is about to happen, but the tape showed no one was willing to dive in with both feet and make it happen.
Bill Williams in his book on chaos trading calls this phenomenon a "Squat", High volume + Narrow price range. This is a signal of a trend reversal. What is happening is, all the volume on the tape is being absorbed by the depth of the order book causing price to stall. Today once the anticipated range expansion breakout failed to materialize, buyers threw in the towel and the "breakout" reversed direction, as you noted.
Click image for original size
Thanks for the thorough explanation.
The chart you posted doesn't seem to be about the OP topic. However, it is very interesting. A day-trading subscription service I receive has been calling for a market top on Friday or Tuesday. I'll be interested in seeing if the S&P can breakout above 1300.
The chart you posted doesn't seem to be about the OP topic. However, it is very interesting. A day-trading subscription service I receive has been calling for a market top on Friday or Tuesday. I'll be interested in seeing if the S&P can breakout above 1300.
I think you're asking about advertised bids and offers, not volume. Volume is what is actually transacted. The bids and offers you see in a DOM are simply 'advertisements', often used to leave the impression of buying or selling pressure, when it fact it may be the opposite. Institutions, HFs, etc (those using algos) love to snare the unsuspecting.....
This site has a nice article on it "Buffers, Flippers and Flasher" Read it.
http://www.mypivots.com/articles/articles.aspx?artnum=19
I'm sure someone will disagree with this or see it differently, but my suggestion is to ignore bid and offer size on the DOM - you will not be able to 'read the tape' and it will only drive you nuts (I can say that because I'm a trading psychologist!)
Good luck.
Originally posted by ETM
In trading the e-mini S&P, I sometimes notice a huge increase in the sitting buy and sell orders. Typically, orders at any level (close to the current price) range from 100 to 1200. I know that's a wide range. But what I'm wondering about is when I'm seeing 2000-4000 at each level.
Order levels often spike on the opening and at the end of the trading day. I get that.
What I'm asking about is why do levels jump at seemingly random times during the day. Today, I saw this at 2:40 EST.
Volume for 2:38 was 396,
2;39 - 1837,
2:40 - 2755,
2:41 - 3941,
2:42 - 5502,
2:43 - 9192
All in all, the market rallied 1.5 point. A few minutes later, it was back down 1.5 points.
It was like there was this big battle.... and then it was over... basically a draw.
Can anyone shed some light on this? The cause? Or more importantly, what to do? Step aside? Tighten stops?
Originally posted by popdoc
I think you're asking about advertised bids and offers, not volume.
Actually, I was asking about both the advertised bids/offers and traded volume. And I was asking about a situation different from the one you addressed.
Thanks for the article.
Emini Day Trading /
Daily Notes /
Forecast /
Economic Events /
Search /
Terms and Conditions /
Disclaimer /
Books /
Online Books /
Site Map /
Contact /
Privacy Policy /
Links /
About /
Day Trading Forum /
Investment Calculators /
Pivot Point Calculator /
Market Profile Generator /
Fibonacci Calculator /
Mailing List /
Advertise Here /
Articles /
Financial Terms /
Brokers /
Software /
Holidays /
Stock Split Calendar /
Mortgage Calculator /
Donate
Copyright © 2004-2023, MyPivots. All rights reserved.
Copyright © 2004-2023, MyPivots. All rights reserved.