ES Tuesday 17/Jan/2012
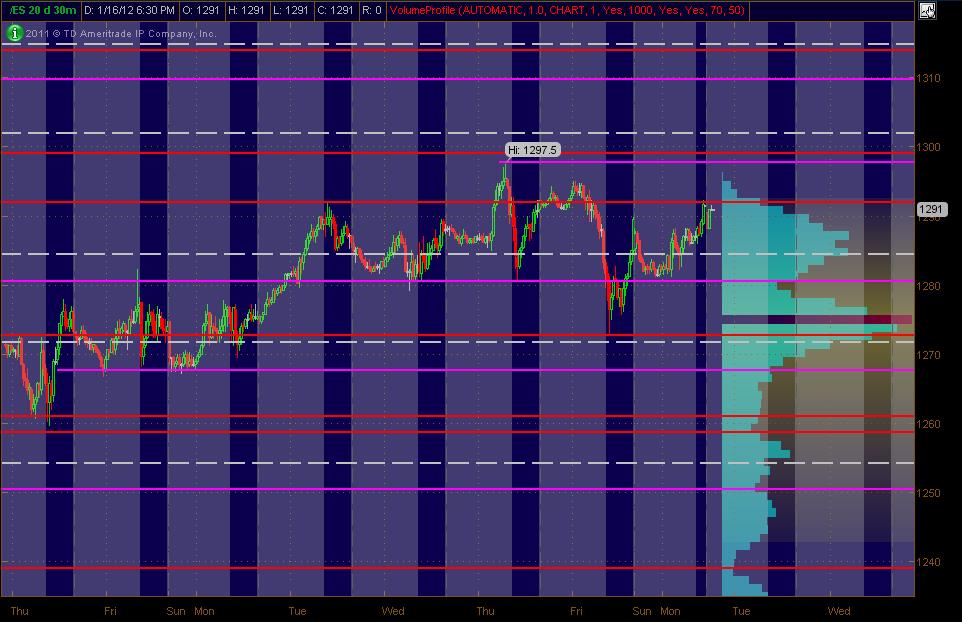
Here's what I've got for my ES MAP of PASR ZONES using a 30min chart of 20 days of data coming into Tuesday's trading. The Red lines are potential significant levels with Magenta lines as semi-significant. The White dashed lines are the Weekly Pivots (kind of a background thing to have on the chart). The Light Blue Volume Profile of the past "rolling" 20 days is displayed on the right vertical axis. Btw, price lines that are CLOSE together (within a couple of points), should be taken as an overall ZONE. The Gray background shows non-RTH price activity. Hope, as always, that this is helpful to some as a "MAP."
(Drew these in on Saturday) ... as of Today's (Monday) price, it moved up into the 1292 area of a PASR level ... will see what overnight holds in store.
(Drew these in on Saturday) ... as of Today's (Monday) price, it moved up into the 1292 area of a PASR level ... will see what overnight holds in store.
Click image for original size
think that i am wrong 85 can come anytime now
some body sent this to me
The S&P 500 Composite Potential Resistance
1576.09, high of 10/11/2007
1552.76, high of 10/31/2007
1523.57, high of 12/11/2007
1498.85, high of 12/26/2007
1440.24, high of 5/19/2008
1406.32, high of 5/29/2008
1381.50, Fibonacci 78.6% of 2007-2009 range
1370.58, high of 5/2/11
1359.44, high of 5/10/11
1356.48, high of 7/7/11
1347.00, high of 7/21/11
1307.28, Fibonacci 78.6% of 2011 range
1296.82, high of 1/12/2012
The S&P 500 Composite Potential Support
1277.58, low of 11/3/2012
1265.26, low of 1/5/2012
1262.30, low of 12/27/2011
1257.89, 200-day SMA
1257.46, low of 12/30/11
1257.58, Fibonacci 61.8% of 2011 range
1255.22, high of 12/22/2011
1248.64, low of 12/29/2011
1244.80, low of 12/7/2011
1239.73, low of 12/1/2011
1238.81, Fibonacci 78.6% of 1,576.09 high
1234.81, low of 11/3/11
1231.04, high of 12/16/11
1226.64, low of 11/9/2011
1222.68, Fibonacci 50% of 2011 range
1224.57, high of 12/19/11
1215.20, low of 12/16/11
1209.47, low of 12/14/2011
1209.43, low of 11/17/2011
1204.49, Fibonacci 23.6% of 2009-11 range
1202.37, low of 12/19/11
1187.77, Fibonacci 38.2% of 2011 range
1158.66, low of 11/25/2011
1144.38, Fibonacci 23.6% of 2011 range
1101.73, Fibonacci 38.2% of 2009-11 range
1074.77, low of 10/4/2011
1039.70, low of 8/27/10
1039.31, Fibonacci 23.6% of June-Aug. 2010 range
1010.91, low of 7/1/2010
1018.69, Fibonacci 50% of 2009-11 range
1008.55, Fibonacci 38.2% of 2009-2010 range
991.97, low of 9/2/2009
978.51, low of 8/17/2009
956.23, high of 6/11/2009
943.29, Gann 50.0% of 2009-2010 range
935.64, Fibonacci 61.8% of 2009-11 range
878.04, Fibonacci 61.8% of 2009-2010 range
874.17, Gann 62.5% of 2009-2010 range
869.32, low of 7/8/2009
817.40, Fibonacci 78.6% of 2009-11 range
805.17, Gann 75.0% of 2009-2010 range
785.13, Fibonacci 78.6% of 2009-2010 range
666.79, intraday low of 3/6/2009
lvn for tomorrow 99.24 , 92.75 91.50, 90.50 lower end 85.0, 83.00 and 77
bruce am i missing any????
75 key rat
bruce am i missing any????
75 key rat
Originally posted by duck
Do these rat numbers change daily?
thanks duck
This should answer your questions.
http://www.mypivots.com/board/topic/7088/-1/the-fib-grid
thanks for the link..so the numbers do not change..this is what i thought reason i ask was della said early rat was 88..
thanks
duck
thanks
duck
I was looking for bruces link from that day 88 is a fib
Originally posted by duck
thanks for the link..so the numbers do not change..this is what i thought reason i ask was della said early rat was 88..
thanks
duck
Bruce's ratchet numbers are permanent fixtures on my charts. I'm constantly impressed at how these numbers prove to be support or resistance. They're not the be all/end all, but they do work with amazing frequency. Definitely a good tool to add to your arsenal.
1304 at least to compete the pattern
Originally posted by vasuki
Bruce are you still here?
Look here for current day's trading topic:
http://www.mypivots.com/board/forum/21/1/trading-strategies-and-setups
Emini Day Trading /
Daily Notes /
Forecast /
Economic Events /
Search /
Terms and Conditions /
Disclaimer /
Books /
Online Books /
Site Map /
Contact /
Privacy Policy /
Links /
About /
Day Trading Forum /
Investment Calculators /
Pivot Point Calculator /
Market Profile Generator /
Fibonacci Calculator /
Mailing List /
Advertise Here /
Articles /
Financial Terms /
Brokers /
Software /
Holidays /
Stock Split Calendar /
Mortgage Calculator /
Donate
Copyright © 2004-2023, MyPivots. All rights reserved.
Copyright © 2004-2023, MyPivots. All rights reserved.