ES Friday 20/Jan/2012
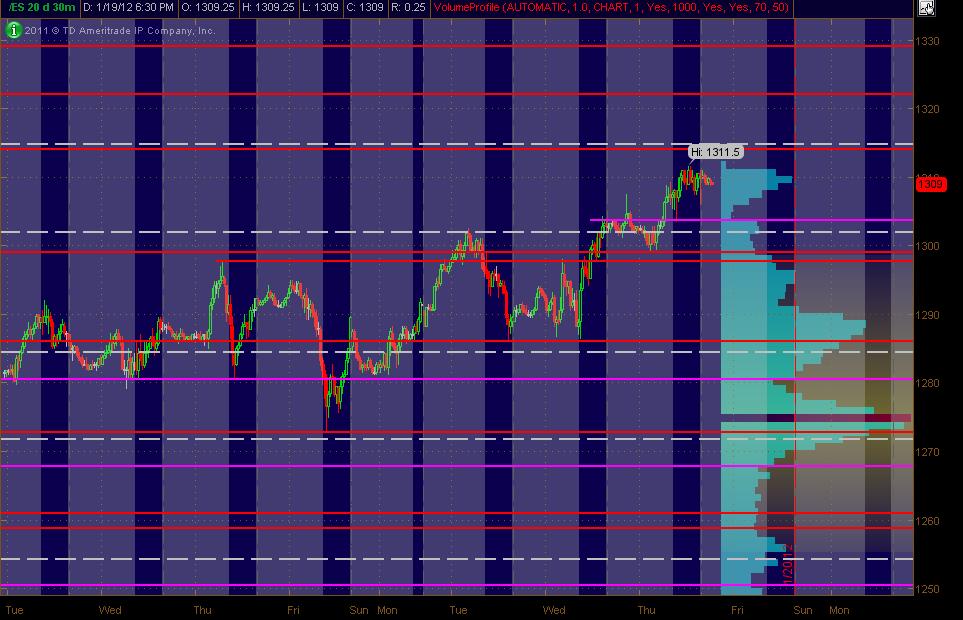
Here's what I've got for my ES MAP of PASR ZONES using a 30min chart of 20 days of data coming into Friday's trading. The Red lines are potential significant levels with Magenta lines as semi-significant. The White dashed lines are the Weekly Pivots (kind of a background thing to have on the chart). The Light Blue Volume Profile of the past "rolling" 20 days is displayed on the right vertical axis. Btw, price lines that are CLOSE together (within a couple of points), should be taken as an overall ZONE. The Gray background shows non-RTH price activity. Hope, as always, that this is helpful to some as a "MAP."
BEWARE OPEX ... lotta cross-currents in mkt.
MM
Click image for original size
BEWARE OPEX ... lotta cross-currents in mkt.
MM
may be this afternoon they may come back to a new high.
I believe they should make a nice Break Out from the recent high since 2 1/2 days the ES has been in an uptrend pattern. Today was arching a MATD and waiting for the BO of the HOD. Let's see...
The IB low was confirming the market has a short interest. It was broken 1306.75
johnpr are u still uuing kool's tools for your trading ?
Originally posted by johnpr2010
The IB low was confirming the market has a short interest. It was broken 1306.75
Nick,
Sometime when the market has a good stretch on the O/N session, since this is not happening around this days I am using MVA and IB for the first 15 min of the market to see where I am going.
Sometime when the market has a good stretch on the O/N session, since this is not happening around this days I am using MVA and IB for the first 15 min of the market to see where I am going.
thanks
Originally posted by johnpr2010
Nick,
Sometime when the market has a good stretch on the O/N session, since this is not happening around this days I am using MVA and IB for the first 15 min of the market to see where I am going.
Nick,
I am using the Double Stochastic as an indicator and is very reliable on all my trades I used it on the 5 min chart best if is 3200 tick chart on my Sierra Chart. It could give u some insight where to get your entry as short or long.
I am using the Double Stochastic as an indicator and is very reliable on all my trades I used it on the 5 min chart best if is 3200 tick chart on my Sierra Chart. It could give u some insight where to get your entry as short or long.
what settings do u use on it ?
not much is going on but anyway sorry for clogging the thread here
not much is going on but anyway sorry for clogging the thread here
Originally posted by johnpr2010
Nick,
I am using the Double Stochastic as an indicator and is very reliable on all my trades I used it on the 5 min chart best if is 3200 tick chart on my Sierra Chart. It could give u some insight where to get your entry as short or long.
30,10, Exp, 10,85
just sent u a pm
Originally posted by johnpr2010
30,10, Exp, 10,85
no clue as I have never followed those markets...sorry!
Emini Day Trading /
Daily Notes /
Forecast /
Economic Events /
Search /
Terms and Conditions /
Disclaimer /
Books /
Online Books /
Site Map /
Contact /
Privacy Policy /
Links /
About /
Day Trading Forum /
Investment Calculators /
Pivot Point Calculator /
Market Profile Generator /
Fibonacci Calculator /
Mailing List /
Advertise Here /
Articles /
Financial Terms /
Brokers /
Software /
Holidays /
Stock Split Calendar /
Mortgage Calculator /
Donate
Copyright © 2004-2023, MyPivots. All rights reserved.
Copyright © 2004-2023, MyPivots. All rights reserved.