Monkey (3,-1) Explanation w/ Chevy Chase
My evolution of (mis)understanding regarding Hunter's recent (3,-1) enigmatic posts ... after much (hours) research and queries with good intentions. Best read and viewed (with video) in context of this topic/thread ... on PAGE 1:
http://www.mypivots.com/board/topic/7228/-1/ymh2-3-1-formula-strategy-381-profit-week-of-23-27-january-2012
http://www.mypivots.com/board/topic/7228/-1/ymh2-3-1-formula-strategy-381-profit-week-of-23-27-january-2012
enigmatic... Well said
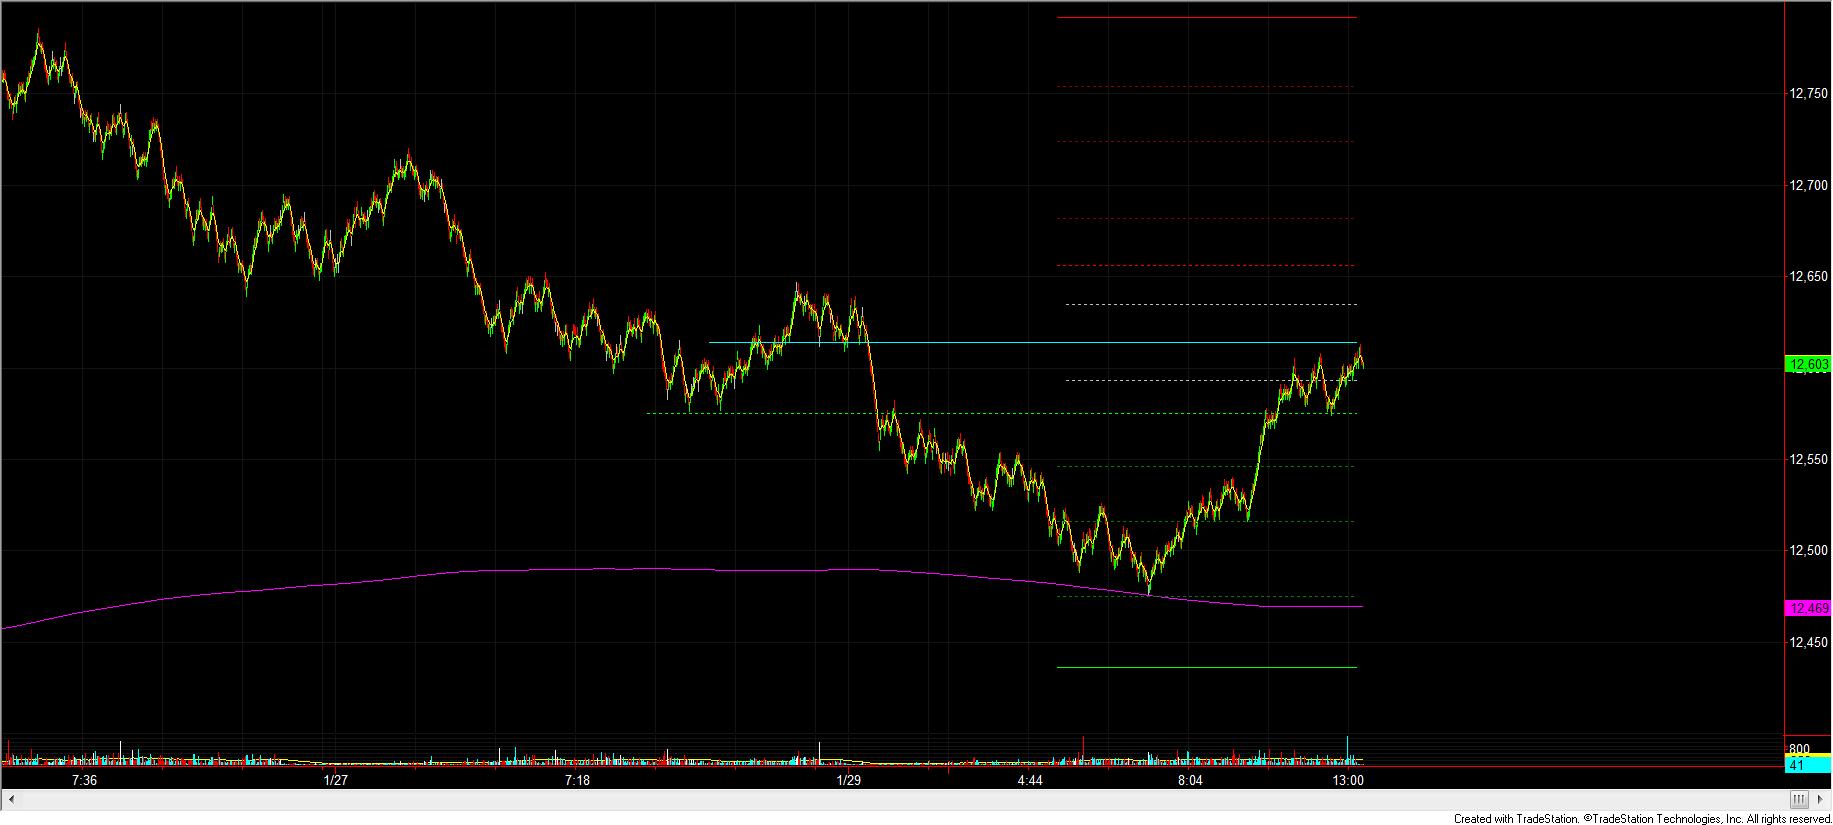
Attached is a chart from Friday's YM close where the horizontal lines are based on Hunter's model. I, and this is just me, CANNOT look at this and say that the math displayed through the price levels on this chart has no relevance.....because is does. The big question is WHY does it illustrate such precision?
To me, there is far more value and relevance in understanding Hunter's posts than trying to apply the mystical MP method of trading the single print from the 30 minute chart and volume distribution across the price.
Try to look at the chart with an open mind.
How I read this chart....from left to right is.
Stretch support into the Friday close.
Close Failure Sunday night.
Stretch Failure Sunday Night.
Level Two and Three failure Sunday night.
Level Four Support Monday Morning. (can you see it?)
Level Three Support (can you see it?)
Blast through Level Two (hard to miss, straight UP!)
Friday close resistance at Monday's close.
The computation of Hunter's price levels is simple math associated with Fibonacci values.
That purple curve down there intersecting Level 4 is a little more advanced.
Hope that helps.....
Click image for original size
Originally posted by grednfer
How I read this chart....from left to right is.
Stretch support into the Friday close.
Close Failure Sunday night.
Stretch Failure Sunday Night.
Level Two and Three failure Sunday night.
Level Four Support Monday Morning. (can you see it?)
Level Three Support (can you see it?)
Blast through Level Two (hard to miss, straight UP!)
Friday close resistance at Monday's close.
The computation of Hunter's price levels is simple math associated with Fibonacci values.
That purple curve down there intersecting Level 4 is a little more advanced.
Hope that helps.....
Thanks for posting. Perhaps you can shed some light on this confusing system.
The problem isn't the math. The problem is trying to figure out which math Hunter is using. 1 stretch, 3 stretches, 4.25 stretches? Do you use a fib multiplier? If price comes w/in 15 points of your entry target, how do you know thats the time to buy.
With your attached chart, what are the lines? Could you identify them?What is the purple line? And the solid green line below it?
Emini Day Trading /
Daily Notes /
Forecast /
Economic Events /
Search /
Terms and Conditions /
Disclaimer /
Books /
Online Books /
Site Map /
Contact /
Privacy Policy /
Links /
About /
Day Trading Forum /
Investment Calculators /
Pivot Point Calculator /
Market Profile Generator /
Fibonacci Calculator /
Mailing List /
Advertise Here /
Articles /
Financial Terms /
Brokers /
Software /
Holidays /
Stock Split Calendar /
Mortgage Calculator /
Donate
Copyright © 2004-2023, MyPivots. All rights reserved.
Copyright © 2004-2023, MyPivots. All rights reserved.