ES Monday 1-30-12
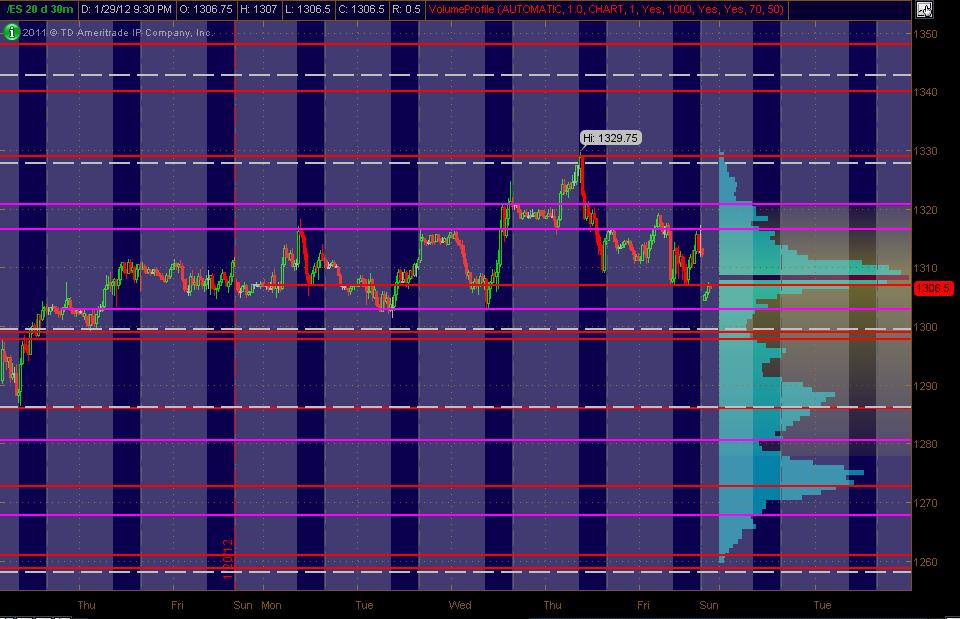
Here's what I've got for my ES MAP of PASR ZONES using a 30min chart of 20 days of data coming into Monday's trading. The Red lines are potential significant levels with Magenta lines as semi-significant. The White dashed lines are the Weekly Pivots (kind of a background thing to have on the chart). The Light Blue Volume Profile of the past "rolling" 20 days is displayed on the right vertical axis. Btw, price lines that are CLOSE together (within a couple of points), should be taken as an overall ZONE. The Gray background shows non-RTH price activity. Hope, as always, that this is helpful to some as a "MAP."
(fyi, drew the lines in on Saturday ... and also, Thinkorswim had data issues coming into Sunday night's session ... thus the data gap)
(fyi, drew the lines in on Saturday ... and also, Thinkorswim had data issues coming into Sunday night's session ... thus the data gap)
Click image for original size
flat...need new lows to see about buying..otherwise I'll miss the train
L 97.50..damn...this is tuff today..can't trade and psost..
yep, tough buys down here..i want to see a flush down to the 94-95 area or below to get some buying going...the 91-92.5 "double low volume area" should not go that easily so it should serve as support
trade under 94 will have me give up on this zone...till then I'll attempt to pick at longs...chart later..officially in the minus 4 - 5.5 zone now
finally we had a third lower low as per segment count...hoping this is the trade our runners can make some progress..concern is that every 2.5 - 3 point pop up is getting sold,,,we need that to change!!
having a hard time getting runners to "stick" today....anyway here is the technical reason I was buying down here and trying to hold....video is my new distraction...ha!
Good video Bruce. Now I have and edge and confluence with my support area.
1301 is my best....no ammo...was thinking that 04 - 05 should get tested but just not sure how much back and fill they will do and we are in that other low volume zone again mentioned on the video..
another thing worth mentioning is look at how last weeks Real time low stopped right at the upper low volume area I mentioned from January 18th.....that 1301.75 is a critical spot for multiple reasons
Cool John..hope it keeps going for all you longs....a great example today of how we can use mutiple methods to arrive at key S?R zones...for me I have the bell curve and then I had the 97.50 as per my weekly VWAP..then the minus 4 - 5.5 zone.....
even with all that it still isn't always easy to actually make trades.....you need to be determined and sometimes a bit agressive in your zones....having money down messes with our minds....that fear of loss is very strong in most of us...
ok...soapbox is kicked aside...the pitbull window is closed due to time and we went 2.5 points above and below the open print
Bruce, a trader will ultimately will figure out what works and what doesn't, and will make money when he or she stops changing plans and sticks to one that works and gives confidence.
Emini Day Trading /
Daily Notes /
Forecast /
Economic Events /
Search /
Terms and Conditions /
Disclaimer /
Books /
Online Books /
Site Map /
Contact /
Privacy Policy /
Links /
About /
Day Trading Forum /
Investment Calculators /
Pivot Point Calculator /
Market Profile Generator /
Fibonacci Calculator /
Mailing List /
Advertise Here /
Articles /
Financial Terms /
Brokers /
Software /
Holidays /
Stock Split Calendar /
Mortgage Calculator /
Donate
Copyright © 2004-2023, MyPivots. All rights reserved.
Copyright © 2004-2023, MyPivots. All rights reserved.