ES Wednesday 2-8-12
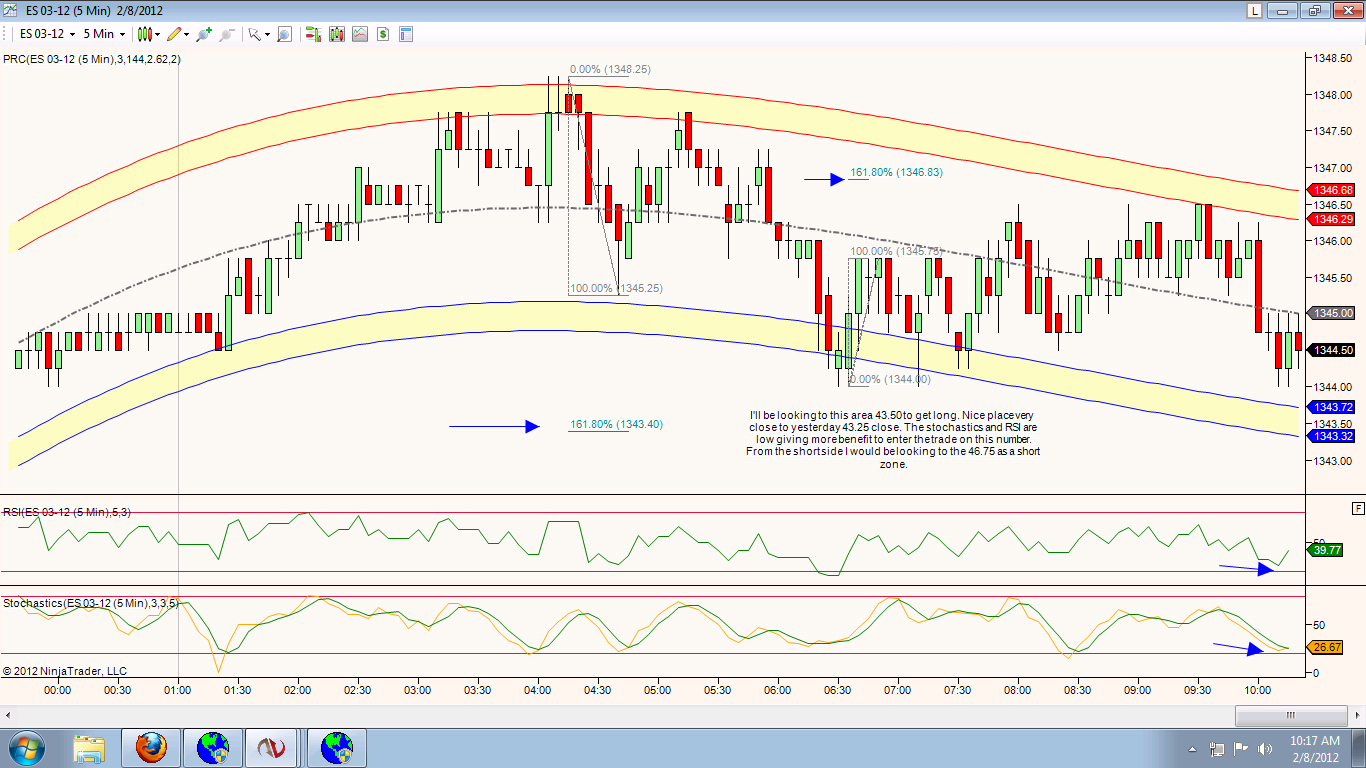
Here is a look at yesterdays trade with the vwap bands and Video. I decided that in many ways video is becoming faster than typing for me...The current Overnight high of 48.25 now has come in right at a vwap band so that confirms that band.
other areas....
Overnight VPOC at 47.....so 47 - 48.25 becomes key resistance
Time is being spent in the 45 area ...so that is attracting price but I will not use that to initiate from unless some pitbull number matches up...would prefer to use that as a target..then we have the evil 42.50 from yesterday which matches the Overnight low and then we have low volume beginning at 1340 which goes well with closing vwap....
below there I will not buy unless we get below 1336
some charts for reference:
Closing Vwap
Overnight against yesterdays day session
Video explanation:
other areas....
Overnight VPOC at 47.....so 47 - 48.25 becomes key resistance
Time is being spent in the 45 area ...so that is attracting price but I will not use that to initiate from unless some pitbull number matches up...would prefer to use that as a target..then we have the evil 42.50 from yesterday which matches the Overnight low and then we have low volume beginning at 1340 which goes well with closing vwap....
below there I will not buy unless we get below 1336
some charts for reference:
Closing Vwap
Click image for original size
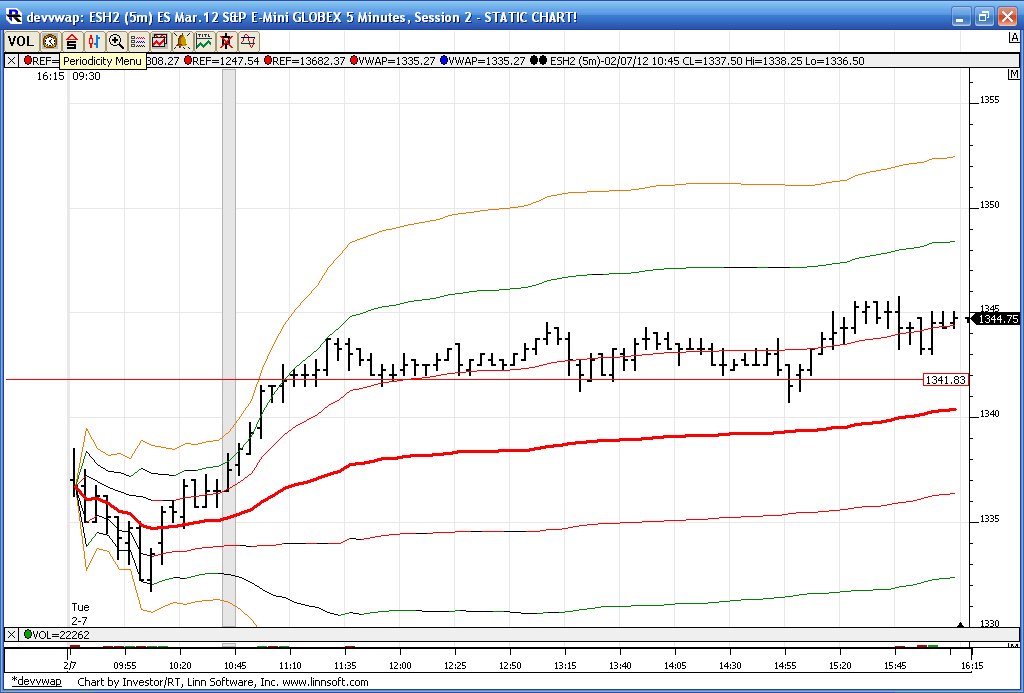
Overnight against yesterdays day session
Click image for original size
Video explanation:
this is great bruce, thanks
one question, how many days are you using for std dev calculation of the vwap?
one question, how many days are you using for std dev calculation of the vwap?
that is only yesterdays data...the weekly stuff is still experimental and I'm not sure if it gives any edge so I'm not posting that now
Click image for original size
RE the video, thanks.
The following comparison is not exact, but it is very similar.
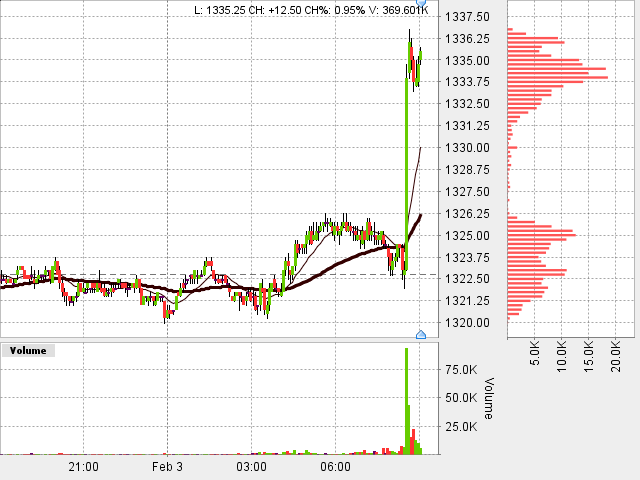
yesterday's RTH profiles that you have posted have a similar look to the overnight volume profile from Th into Friday 2-3-12 (tried to post it below)
a small bell at lower prices and then a pronounced bell (pointed) at higher prices. I don't know whether comparing an RTH to an overnight is of any value, but at least for this configuration (small bell lower, larger bell at higher prices) it speaks volmes of trapped bears (maybe.
Here's what I'm curious about: does this double bell (with a larger bell at the higher prices) form a floor?
In last night's PA, the double bell from yesterday's RTH sure looks like it defined a floor.
when I looked at the PA from Friday's RTH (the first session after the overnight double bell with a larger bell at the higher prices, I see that in Friday's RTH, price had an LOD of 32.75, virtually AT the overnight POC of Volume, and RE today, the overnight respected yesterday's RTH bigger bell.
I was just curious whether anyone who looks at the VP and the TPO has ever seen this combo pattern before. Curious if it has predictive power.
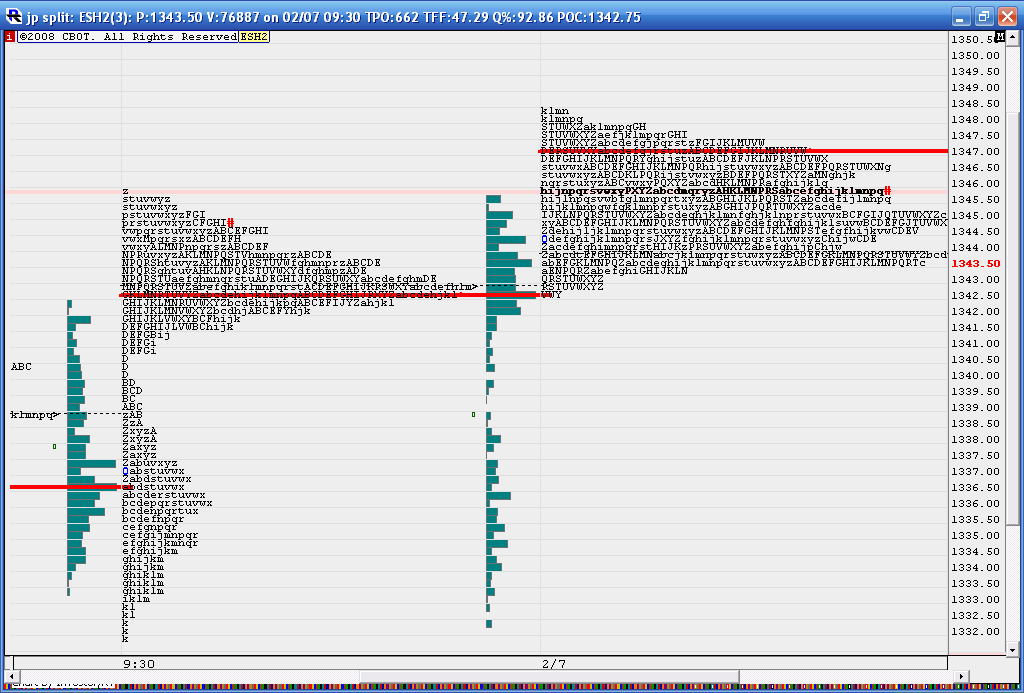
here's the picture I took of the overnight thurs into Friday 2-3-12,
the day did not really have any large retracements as during Friday's RTH, the first test of the VPOC was bought and price meandered higher.
I just wonder whether that same action (buying a test of the larger bell in a two bell session) happens regularly?
The following comparison is not exact, but it is very similar.
yesterday's RTH profiles that you have posted have a similar look to the overnight volume profile from Th into Friday 2-3-12 (tried to post it below)
a small bell at lower prices and then a pronounced bell (pointed) at higher prices. I don't know whether comparing an RTH to an overnight is of any value, but at least for this configuration (small bell lower, larger bell at higher prices) it speaks volmes of trapped bears (maybe.
Here's what I'm curious about: does this double bell (with a larger bell at the higher prices) form a floor?
In last night's PA, the double bell from yesterday's RTH sure looks like it defined a floor.
when I looked at the PA from Friday's RTH (the first session after the overnight double bell with a larger bell at the higher prices, I see that in Friday's RTH, price had an LOD of 32.75, virtually AT the overnight POC of Volume, and RE today, the overnight respected yesterday's RTH bigger bell.
I was just curious whether anyone who looks at the VP and the TPO has ever seen this combo pattern before. Curious if it has predictive power.
here's the picture I took of the overnight thurs into Friday 2-3-12,
the day did not really have any large retracements as during Friday's RTH, the first test of the VPOC was bought and price meandered higher.
I just wonder whether that same action (buying a test of the larger bell in a two bell session) happens regularly?
Click image for original size
I'm looking to sell above 46.50 or buy below 42.50 ...ideally down near 40...using the 45 as a magnet in general..so the further we can push away from there then the bigger the profit target can be
Originally posted by johnpr2010
Click image for original size
Yesterday's close was 1344.75 wasn't it??
My order has been fill
Out all at 45.50
s on 47 print...small as may need to add.....I think they will come back for 44.75 - 45
Ill try to show later , probably tomorrow why i think timewise the ideal time for a price peak would likely be next week between the 14th and 16th. Im expecting bullish behavior untill then ,so caution is advised on all short sales
Emini Day Trading /
Daily Notes /
Forecast /
Economic Events /
Search /
Terms and Conditions /
Disclaimer /
Books /
Online Books /
Site Map /
Contact /
Privacy Policy /
Links /
About /
Day Trading Forum /
Investment Calculators /
Pivot Point Calculator /
Market Profile Generator /
Fibonacci Calculator /
Mailing List /
Advertise Here /
Articles /
Financial Terms /
Brokers /
Software /
Holidays /
Stock Split Calendar /
Mortgage Calculator /
Donate
Copyright © 2004-2023, MyPivots. All rights reserved.
Copyright © 2004-2023, MyPivots. All rights reserved.