ES Wednesday 2-15-12
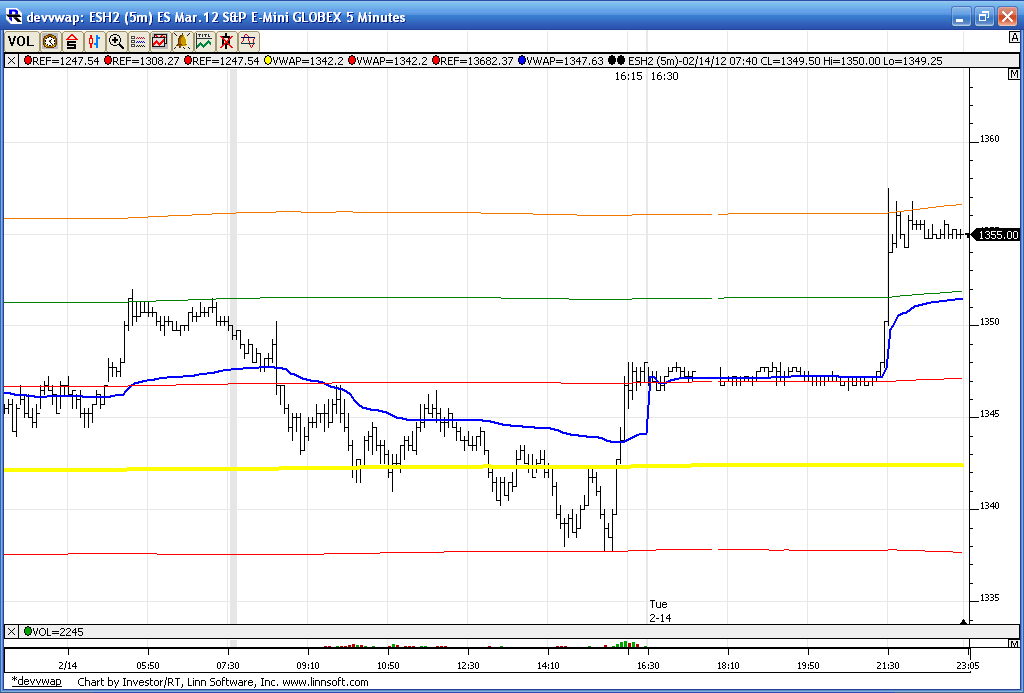
A look at the cummulative vwap bands.....as I type we are building volume at 1355.50 in the overnight session .....It will be interesting to see what happens as the 3rd standard deviation off the weekly band comes in at 1356 - 57. A 4th deviation move would come in at 1360 which goes well with a weekly R2 level. For me I'm staying up a bit later tonight and looking to get short up here now. Hopefully the sacrifice will pay off.
I changed the cummulative vwap band to be yellow so there are no errors. This also contains Overnight data but since the O/N doesn't have much volume the bands don't change much.
Some good levels shaping up for tomorrows day session which would include 1351.50, 1347.25 and then the critical 42.50 - 44 zone...
Click image for original size
Yes my entry is still valid unless we break the RTH High giving a signal strong to the upside and wanting to get to 64.50
Originally posted by khamore1
John are you still going to enter long at 46.25? is 45.75 the high of the other day look better for you?
Originally posted by NickP
up until now we seem to have been filling all that low volume/low tpo area from overnight (big ellipse in the attached link); the upper and lower bounds of that area are monday's and tuesday's o/n session highs on one side and yesterday's rth high on the other
a break and run above should target that 55-56 area above while a break below should take us to that 42.5-45 area that has volume, yesterday's vwap and poc along with a rat number
bruce mentioned most of this info in his video earlier today but just thought the action this morning looked cool, put together with that 48-49 area i mentioned earlier
http://www.sierrachart.com/userimages/upload_2/1329322229995.png
Great chart. I'm gonna put on In-A-Gadda-Da-Vida a bit later and really explore it!
Your going to run into a little resistance here as 1352.75 was the up projection from the recent 1347.50 low today
Have 1354.75 as a proj. short 1.618% Good to scalp 1.25pts since we are in a dead zone lunch time.
Id be covering here 1350 on any short from 1352.75!
missed by one tick!...great call, Johnpr
we did not hesitate much to shoot straight to the 42.5-45 area once we got below yesterday's rth high
Originally posted by NickP
up until now we seem to have been filling all that low volume/low tpo area from overnight (big ellipse in the attached link); the upper and lower bounds of that area are monday's and tuesday's o/n session highs on one side and yesterday's rth high on the other
a break and run above should target that 55-56 area above while a break below should take us to that 42.5-45 area that has volume, yesterday's vwap and poc along with a rat number
bruce mentioned most of this info in his video earlier today but just thought the action this morning looked cool, put together with that 48-49 area i mentioned earlier
http://www.sierrachart.com/userimages/upload_2/1329322229995.png
great point Nick.....if you are targeting VWAP from a particular day then you need to it to hold inside the range of that day otherwise your odds decrease to hit that VWAP target...
a simple but powerful truth...we use the ranges to qualify our chances of hitting further targets..
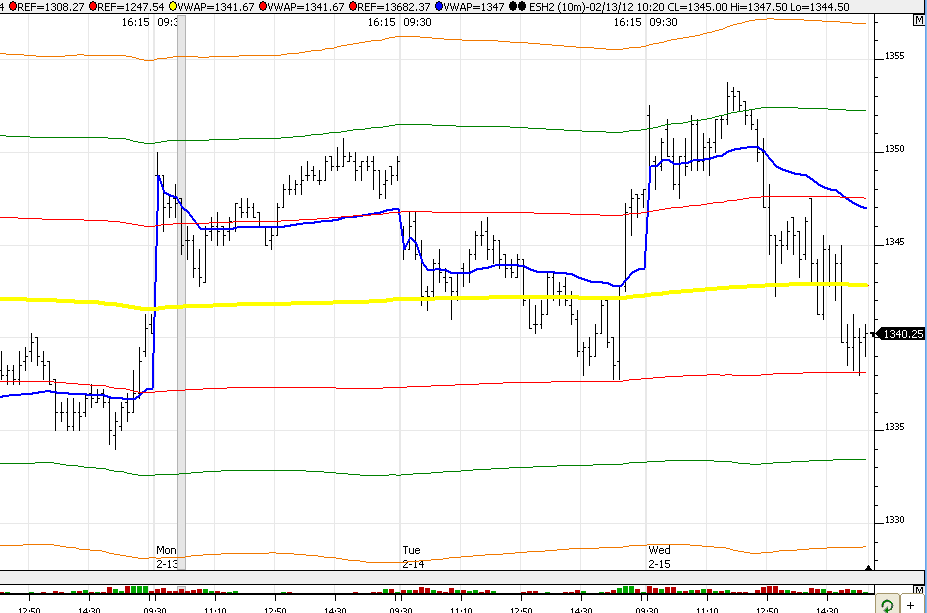
here is an update to my earlier VWAP chart but without the overnight data included...I find more often than not the inclusion of the O/N data has very little impact on the lines unless we have big volume from reports or other surprises. Even then the lines do not change much when u look at a longer time period.
a simple but powerful truth...we use the ranges to qualify our chances of hitting further targets..
here is an update to my earlier VWAP chart but without the overnight data included...I find more often than not the inclusion of the O/N data has very little impact on the lines unless we have big volume from reports or other surprises. Even then the lines do not change much when u look at a longer time period.
Originally posted by NickP
we did not hesitate much to shoot straight to the 42.5-45 area once we got below yesterday's rth high
Originally posted by NickP
up until now we seem to have been filling all that low volume/low tpo area from overnight (big ellipse in the attached link); the upper and lower bounds of that area are monday's and tuesday's o/n session highs on one side and yesterday's rth high on the other
a break and run above should target that 55-56 area above while a break below should take us to that 42.5-45 area that has volume, yesterday's vwap and poc along with a rat number
bruce mentioned most of this info in his video earlier today but just thought the action this morning looked cool, put together with that 48-49 area i mentioned earlier
http://www.sierrachart.com/userimages/upload_2/1329322229995.png
Click image for original size
I'm looking for reviews on Sierra charts,,,can those who use them give me the good and bad points when they have time please ? either here or in PM...
Thanks
Thanks
Bruce check your email
Thanks to everyone for giving BruceM feedback on Sierra Charts. Traders are often commenting on software and brokers in the forum and these comments and reviews get lost over time so I would like to suggest that you go to the Sierra Charts page and click the Review Sierra Charts link near the top and put your comments there instead (or as well). That way everyone will benefit from your experience about this product. Thanks!
All software products (including Sierra Charts) can be found here:
http://www.mypivots.com/software
All brokers can be found here:
http://www.mypivots.com/broker
All software products (including Sierra Charts) can be found here:
http://www.mypivots.com/software
All brokers can be found here:
http://www.mypivots.com/broker
Emini Day Trading /
Daily Notes /
Forecast /
Economic Events /
Search /
Terms and Conditions /
Disclaimer /
Books /
Online Books /
Site Map /
Contact /
Privacy Policy /
Links /
About /
Day Trading Forum /
Investment Calculators /
Pivot Point Calculator /
Market Profile Generator /
Fibonacci Calculator /
Mailing List /
Advertise Here /
Articles /
Financial Terms /
Brokers /
Software /
Holidays /
Stock Split Calendar /
Mortgage Calculator /
Donate
Copyright © 2004-2023, MyPivots. All rights reserved.
Copyright © 2004-2023, MyPivots. All rights reserved.