ES Monday 2-27-12
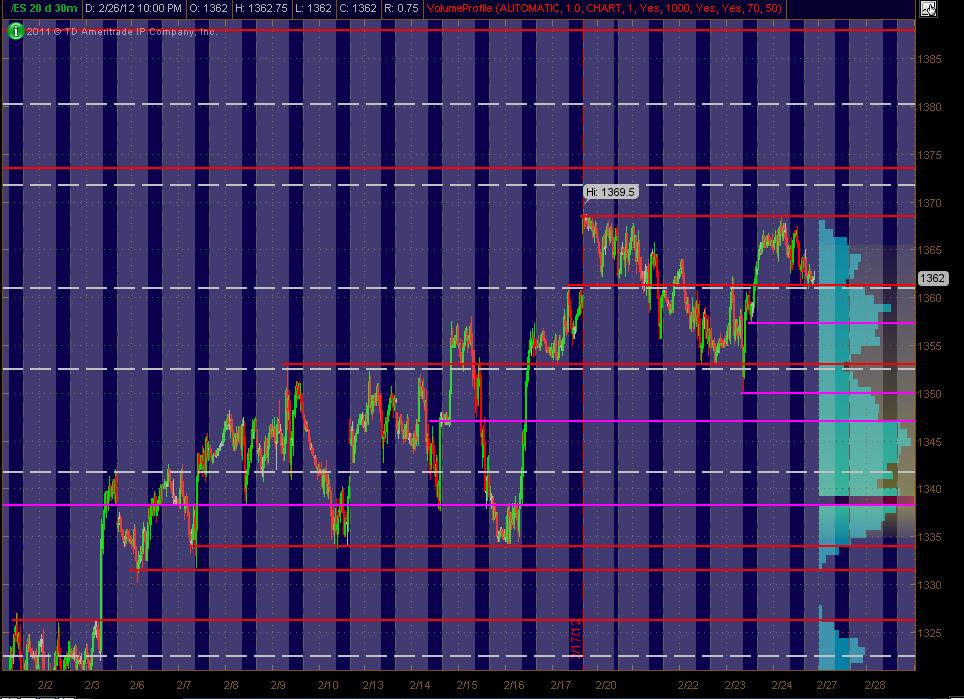
Here's what I've got for my ES MAP of PASR ZONES using a 30min chart of 20 days of data coming into Monday's trading. The Red lines are potential significant levels with Magenta lines as semi-significant. The White dashed lines are the Weekly Pivots (kind of a background thing to have on the chart). The Light Blue Volume Profile of the past "rolling" 20 days is displayed on the right vertical axis. The Gray background shows non-RTH price activity. Hope, as always, that this is helpful to some as a "MAP."
Click image for original size
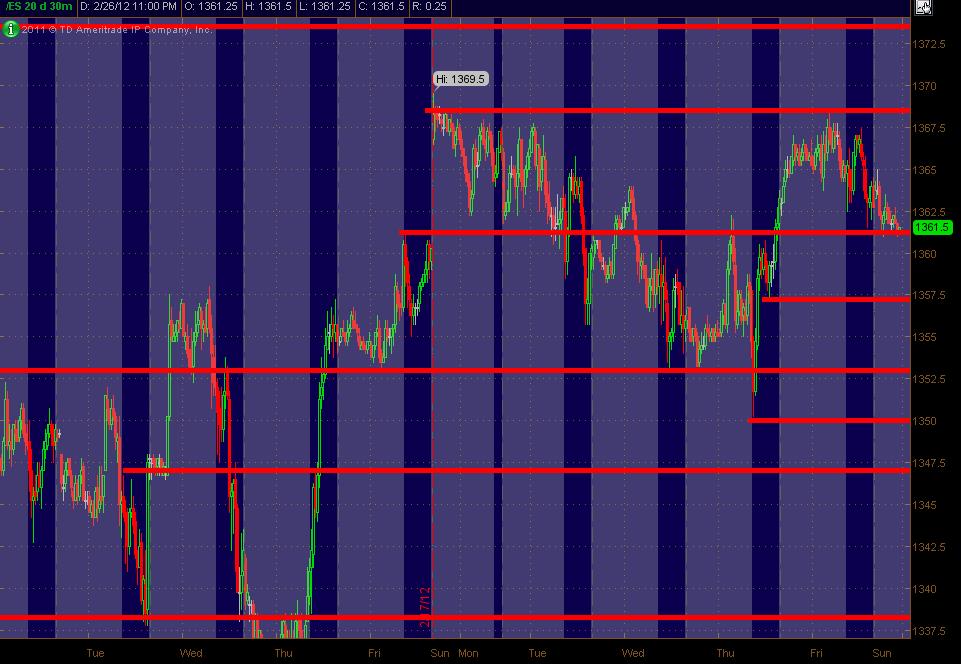
And here's the stripped down chart with Red Zones of PASR ... the support/resistance without any other "stuff" to clutter up things.
Hope all bank on Monday!
Click image for original size
Hope all bank on Monday!
always helpful MM. thanks.
here's my overall plan for today early on:
starting longs at 54.25... a more conservative trader would require price to get back above the Overnight lows again to think about longs...
52 is a number to lean on below if needed
52 is a number to lean on below if needed
targets are 57 and 59 for me...need to resolve the O/N lows now...critical for us longs to get back over that
we are real close to the second SD band off weekly Vwap so buyers should be stepping up here and if it wasn't for the 10 am reports I would be adding a bit more agressively too....
band is actually at 52.75 as per vwap chart
band is actually at 52.75 as per vwap chart
Real Tricky here.
I have mentioned this before.
Gap Guy says Chaikin watches 600 xma of 5minute charts RTH only, WHY, because it is the 200 on 15minute bars and the 100 on 30minute bars
many eyes focused on that level from different short-term time frames.
that 600xma was 1356.25 this morning.
he has noted that when price gaps past the 600xma, (either direction)more times than not, gap does not fill and the 600 is a barrier.
that 56.25 represents a barrier (potential), but it also represents a potential bear trap for today's market because if price can work its way above today's open and above the 600xma, bears will be trapped short (could be forced to buy if 56.25 exceeded)
my vote is the bear trap Paul..nothing is telling me that this symetric trade has changed....60 is still ultimate target I think...will get out in front of that
very nice trade bruce
Great work bruce!
well up is up..my eyesight may be failing but on my chart that line goes at an up angle...3.25 points up is not that big a deal..unless of course you are short 50 contracts!...just saying..nice night everyone
Click image for original size
Emini Day Trading /
Daily Notes /
Forecast /
Economic Events /
Search /
Terms and Conditions /
Disclaimer /
Books /
Online Books /
Site Map /
Contact /
Privacy Policy /
Links /
About /
Day Trading Forum /
Investment Calculators /
Pivot Point Calculator /
Market Profile Generator /
Fibonacci Calculator /
Mailing List /
Advertise Here /
Articles /
Financial Terms /
Brokers /
Software /
Holidays /
Stock Split Calendar /
Mortgage Calculator /
Donate
Copyright © 2004-2023, MyPivots. All rights reserved.
Copyright © 2004-2023, MyPivots. All rights reserved.