ES Tuesday 3-27-12
I just wanted to post a chart here because I didn't think anyone would be going back to yesterday's thread and I am a big believer that a picture is worth a thousand words.
Yesterday at 10:33 I posted the following
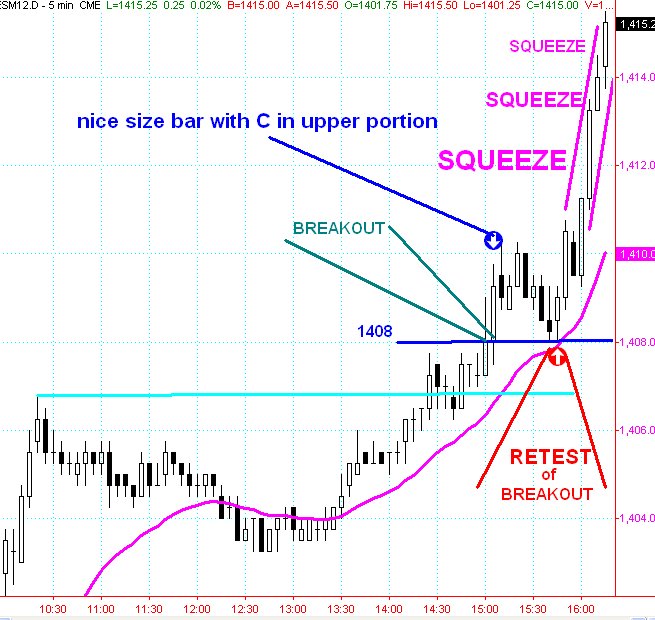
"Price is so close to the monthly R2 ( last week H was 1408.00, that was first test), anyway, price is so close that it would be perfectly natural to test that 1407.50-1408.00 level again.
"if price blasts through it, then longer term time frame breakout players are buying. (price could come back and test the breakout point but if it goes above the high of the first breakout, squeeze de la squeeze"
It is the second paragraph that I am trying to illustrate here.
This is a simple pattern (although usually not so precisely "to the tick" as yesterday) that appears again and again. anyone can file this in the old cranium for future reference.
magenta line on the chart is just 20 period exponential, data is RTH only 5min bars.
Yesterday at 10:33 I posted the following
"Price is so close to the monthly R2 ( last week H was 1408.00, that was first test), anyway, price is so close that it would be perfectly natural to test that 1407.50-1408.00 level again.
"if price blasts through it, then longer term time frame breakout players are buying. (price could come back and test the breakout point but if it goes above the high of the first breakout, squeeze de la squeeze"
It is the second paragraph that I am trying to illustrate here.
This is a simple pattern (although usually not so precisely "to the tick" as yesterday) that appears again and again. anyone can file this in the old cranium for future reference.
magenta line on the chart is just 20 period exponential, data is RTH only 5min bars.
Click image for original size
if you look at the left side of my chart above u can make out the first LVN mini bell curve at 1410.50..the other one sits at 07.75..hence my comment about the first key zone.but still we gotta get on the bull side of the current VWAP etc which is right at the O/N lows..no surprise except I thought they would move it higher up by now
thanks,
and I can see the buying tails on the past three 5 min bars.
welp, guess I blew it.
and I can see the buying tails on the past three 5 min bars.
welp, guess I blew it.
not sure u blew it Paul...my concern is that poor low shows no buying impulse but the high of today with triples is showing no rush to get short either....
if I get stopped on runners at new lows then I will try one more time on the longside and call it a day...didn't go specifically as planned but good enough for now...still think new highs will come but not willing to play at this all day to get that target
if I get stopped on runners at new lows then I will try one more time on the longside and call it a day...didn't go specifically as planned but good enough for now...still think new highs will come but not willing to play at this all day to get that target
As you probably already know, most of the time, I am finished trading by noon.
I personally would prefer to see some sort of double bottom.
there is a very well defined downtrend line apparent on the 5 min bars starting with H of the bar that completed at 855am.
I personally would prefer to see some sort of double bottom.
there is a very well defined downtrend line apparent on the 5 min bars starting with H of the bar that completed at 855am.
see it..that's why I'm a buyer
Originally posted by PAUL9
where's jedi?
I need an interpretation of the VOLD. I stuck it onto a chart and put a horizontal line at zero (did that a couple weeks ago), and right now, you can't even see the VOLD bars (the horizontal line is thicker than the entire range of the VOLD so far today.
It is just flat.
Paul,
The VOLD gives no info tdy, but I would consider consolidation above 1408 bullish. For the way I trade, there is no set up for me except maybe a long@1407-1408. The reason is 1408 os the BO area and also 3-4pts outside of OR. The drawdown of that set ups is that we're coming off a narrow OR and off of highs.. If you like that set up, the stop for me would be 1406.. perhaps a scale in at 1408/1407 and hold for your targets.. for me this trade would prob be somewhere in midrange and HOD if that trade bounced from there..
Jedi
message has to be longer than 10 characters so when I first replied 'THANKS' and hit <post new reply> it just sat here while I moved to different computer.
so now I have satisfied minimum for transmission of 10 characters.
so now I have satisfied minimum for transmission of 10 characters.
I didn't exit on the new low due to the shape of the current bell curve and my bigger plan was to buy in the 08 - 1410.50 zone anyway.
since this morning was good I am holding this and will exit with a 30 minute close under 1408.50 or new highs on the day whichever come first. This is a revised strategy for me and is based on a longer term view. Not my usual style so I am willing to take a slightly bigger risk instead of having to actively trade in here now.
We are getting to that time of day soon where they should decide on some direction soon. The peak volume price is currently higher that yesterday and we have consolidated above yesterdays VA highs. Logically value is higher but we'll see if price follows logic today.
cummulative $ticks are still in an uptrend..
Emini Day Trading /
Daily Notes /
Forecast /
Economic Events /
Search /
Terms and Conditions /
Disclaimer /
Books /
Online Books /
Site Map /
Contact /
Privacy Policy /
Links /
About /
Day Trading Forum /
Investment Calculators /
Pivot Point Calculator /
Market Profile Generator /
Fibonacci Calculator /
Mailing List /
Advertise Here /
Articles /
Financial Terms /
Brokers /
Software /
Holidays /
Stock Split Calendar /
Mortgage Calculator /
Donate
Copyright © 2004-2023, MyPivots. All rights reserved.
Copyright © 2004-2023, MyPivots. All rights reserved.