ES Tuesday 4-3-12
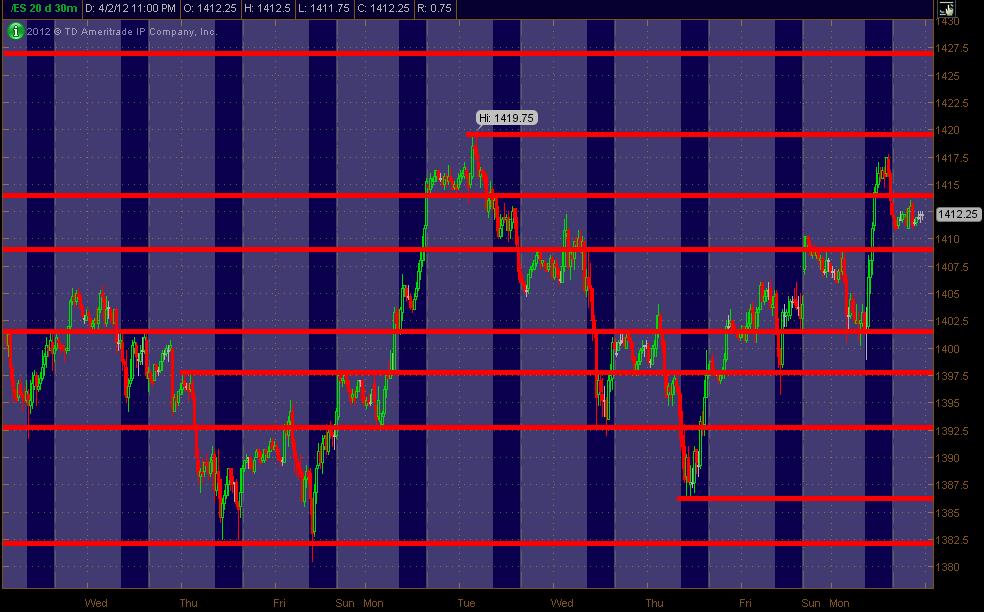
Here's my ES map of PASR price areas coming into Tuesday's trading on a 30min chart. Gray background represents "after hours" trading with Blue blackground being RTH. Call it the MONKEY S/R ZONES. Hope it's helpful to both ES traders and equity traders as a "map."
Confluence of Weekly Pivots at 1386 and 1420 ... Daily Pivot at 1420 fwiw. The 1417.75 area is yday's RTH high with 1419.75 the overnight high from just a few days back ... some price levels to also keep an eye on as price action unfolds into them (if it moves that direction). 1409-10 is a VolProf LVN and 1427 is a minor Fib cluster. All of these price levels listed coincide with the Red PASR zones.
Click image for original size
Confluence of Weekly Pivots at 1386 and 1420 ... Daily Pivot at 1420 fwiw. The 1417.75 area is yday's RTH high with 1419.75 the overnight high from just a few days back ... some price levels to also keep an eye on as price action unfolds into them (if it moves that direction). 1409-10 is a VolProf LVN and 1427 is a minor Fib cluster. All of these price levels listed coincide with the Red PASR zones.
There's a lot of VolProf and MP with Bruce and others updated as the a trading day unfolds ... along with posts of others with Fib analysis and other approaches. I wanted to poll all of you trading folks out there in mypivots. I typically post ONE chart with S/R levels I derive from the basics of prior price action. And, I often include calculated pivots that coincide with those levels ... and a Fib cluster here and there if it stands out to me.
Is this something y'all find useful? In other words, should I keep posting the chart of the ES going forward. I'll simply look at the votes on this post to determine if y'all find it useful enough for me to keep posting it.
Let me know what you think ... good or bad. I do it for myself, obviously ... and it takes quite a bit of time to truly evaluate and nail down the levels that this Monkey sees.
Anyway,just let me know if it's something I should keep posting ... or not, since it takes time to craft it and post it in the forum.
Thanks!
MM
MM. I find the info you post extremely helpful and appreciate the effort.
MM thanks and useful.
Very useful. Please continue. Thanks.
Yes, helpful, please continue. The site is very useful even though I remain a lurker I appreciate all of the contributions. Thanks to all who post.
Any chart or video posting I find helpful as well, great information, Thanks
Of the O/N low initial move I got 2.618 fib extension level @1415.00. I would be taking this level short since my DS(Double Stochastics) line is on above the overbought area and the PA(Price Action) is on the PRC top channel.
I cancelled the 1414.75 and lookin a better way with a new fib extension to the 1406.00-1406.50 are for a long push...
all out on 1408.00.
Emini Day Trading /
Daily Notes /
Forecast /
Economic Events /
Search /
Terms and Conditions /
Disclaimer /
Books /
Online Books /
Site Map /
Contact /
Privacy Policy /
Links /
About /
Day Trading Forum /
Investment Calculators /
Pivot Point Calculator /
Market Profile Generator /
Fibonacci Calculator /
Mailing List /
Advertise Here /
Articles /
Financial Terms /
Brokers /
Software /
Holidays /
Stock Split Calendar /
Mortgage Calculator /
Donate
Copyright © 2004-2023, MyPivots. All rights reserved.
Copyright © 2004-2023, MyPivots. All rights reserved.