ES Tuesday 4-24-2012
I got a fib level @ 1372.50 to go short since the PRC band is behind and the Double Stochastics is at high level. the LVN is here tooo. Let's see what happen next leaving my order open for now.
Click image for original size
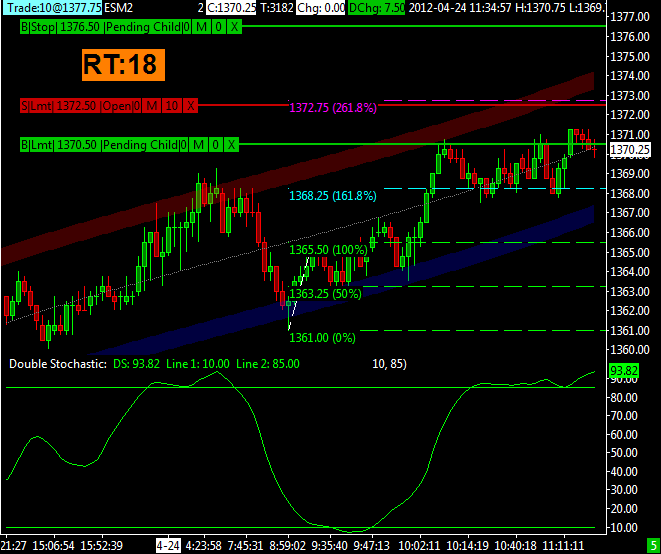
using the mp calculator provided by mypivots .. I have a sell zone from 1365.75 / 1371.50 .. tough area so far
just curious how you come up with such sell zone from using the mp calculator
thanks
thanks
Originally posted by redsixspeed
using the mp calculator provided by mypivots .. I have a sell zone from 1365.75 / 1371.50 .. tough area so far
I am changing my zone since the market did not have enough volume interest to get to the target. I am looking for a target long zone @1363.00 having all technicals on my favor once it reach to the number. See the next chart.
Click image for original size

Originally posted by apk781
just curious how you come up with such sell zone from using the mp calculator
thanks
Originally posted by redsixspeed
using the mp calculator provided by mypivots .. I have a sell zone from 1365.75 / 1371.50 .. tough area so far
Does your strategy show these areas as key on your chart as well
no, not really...but i am asking since it reads from your post that you came up with your sell zone by using just the mp calculator...and i am wondering how...that's all
Originally posted by redsixspeed
Originally posted by apk781
just curious how you come up with such sell zone from using the mp calculator
thanks
Originally posted by redsixspeed
using the mp calculator provided by mypivots .. I have a sell zone from 1365.75 / 1371.50 .. tough area so far
Does your strategy show these areas as key on your chart as well
Originally posted by apk781
no, not really...but i am asking since it reads from your post that you came up with your sell zone by using just the mp calculator...and i am wondering how...that's all
Originally posted by redsixspeed
Originally posted by apk781
just curious how you come up with such sell zone from using the mp calculator
thanks
Originally posted by redsixspeed
using the mp calculator provided by mypivots .. I have a sell zone from 1365.75 / 1371.50 .. tough area so far
Does your strategy show these areas as key on your chart as well
You didn't see these areas.
What tools are you using to find key areas
i think i already said i don't see them
i use fib numbers mostly
i use fib numbers mostly
Originally posted by redsixspeed
Originally posted by apk781
no, not really...but i am asking since it reads from your post that you came up with your sell zone by using just the mp calculator...and i am wondering how...that's all
Originally posted by redsixspeed
Originally posted by apk781
just curious how you come up with such sell zone from using the mp calculator
thanks
Originally posted by redsixspeed
using the mp calculator provided by mypivots .. I have a sell zone from 1365.75 / 1371.50 .. tough area so far
Does your strategy show these areas as key on your chart as well
You didn't see these areas.
What tools are you using to find key areas
Emini Day Trading /
Daily Notes /
Forecast /
Economic Events /
Search /
Terms and Conditions /
Disclaimer /
Books /
Online Books /
Site Map /
Contact /
Privacy Policy /
Links /
About /
Day Trading Forum /
Investment Calculators /
Pivot Point Calculator /
Market Profile Generator /
Fibonacci Calculator /
Mailing List /
Advertise Here /
Articles /
Financial Terms /
Brokers /
Software /
Holidays /
Stock Split Calendar /
Mortgage Calculator /
Donate
Copyright © 2004-2023, MyPivots. All rights reserved.
Copyright © 2004-2023, MyPivots. All rights reserved.