Chart for start of week 7/16
Here are my significant S/R levels going into the week. Have some other minor levels but this is the bulk of the framework. Good luck to all.
Click image for original size
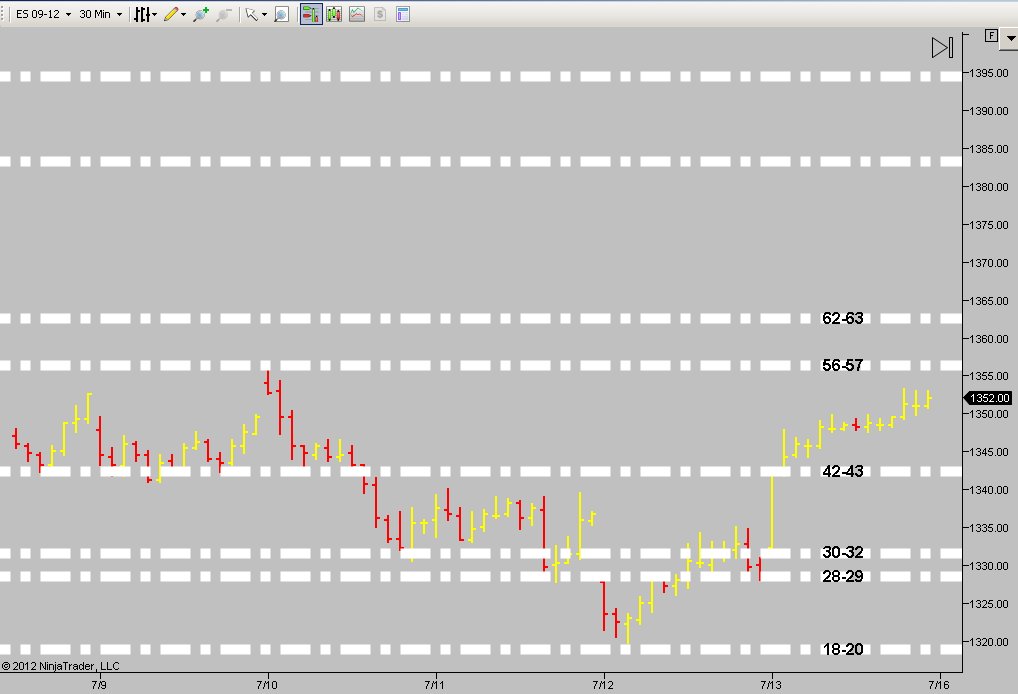
Great stuff Big Mike....that was huge volume on Friday that came in at 1342.25 - 1344.50 and critical support as you already show...I also have the 48.50 from friday but volume wasn't as strong there....thanks for that chart!!
How is the Ib strategy working ?
How is the Ib strategy working ?
Originally posted by BruceM
How is the Ib strategy working ?
I'm not sure what you're referencing Bruce?
I may be mistaken but I thought you had stopped posting for a while because you were working on an initial balance breakout idea or something ...perhaps I have you confused with somebody else
Originally posted by Big Mike
Originally posted by BruceM
How is the Ib strategy working ?
I'm not sure what you're referencing Bruce?
I went to a automated trade setup, works fine But I keep looking for other stuff to keep the juices flowing.
Double edged sword to say the least, need the excitement/juice, but that hurts my performance.
Double edged sword to say the least, need the excitement/juice, but that hurts my performance.
Hey Bruce, was wondering abt the volume levels you posted. Here is my market profile/vol chart from friday (dtn-iq data btw)
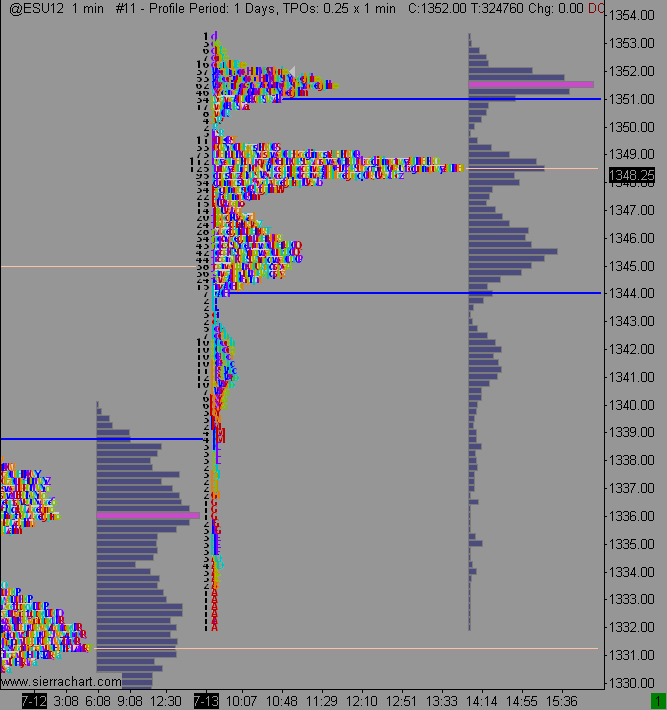
I am not showing strong volume in the 42.25-44.5 area as u mentioned, just some volume and a low vol zone in that area. Strong volume for me came in the 51-51.5 area, with 45.5 and 48.5 fighting for the silver medal
double checked my data with ib and seems to agree so i am little confused as to what r u seeing in that 42.25-44.5 area
thanks
Originally posted by BruceM
Great stuff Big Mike....that was huge volume on Friday that came in at 1342.25 - 1344.50 and critical support as you already show...I also have the 48.50 from friday but volume wasn't as strong there....thanks for that chart!!
How is the Ib strategy working ?
NickP,
Can you post a chart of volume profile based on the Week?
maybe that would show something.
(I don't have volume profile abilities or I would do it myself)
Can you post a chart of volume profile based on the Week?
maybe that would show something.
(I don't have volume profile abilities or I would do it myself)
I was wrong (imagine that, I'll have to put that down on the long long list of when Paul was wrong)
I at least have a 4 days VP prior to today.
I at least have a 4 days VP prior to today.
Click image for original size
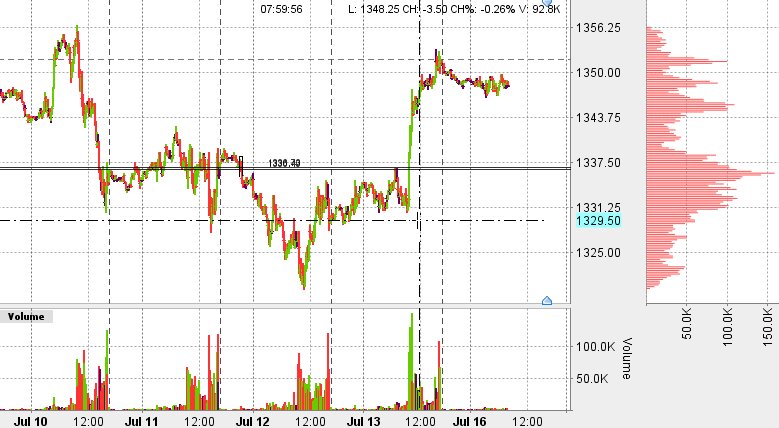
there u go
http://www.sierrachart.com/userimages/upload_2/1342440262157.png
the weekly profile seems to support a little better what bruce was saying, but i was under the impression that he mainly looks at daily profiles for his numbers (i might be wrong on this though)
http://www.sierrachart.com/userimages/upload_2/1342440262157.png
the weekly profile seems to support a little better what bruce was saying, but i was under the impression that he mainly looks at daily profiles for his numbers (i might be wrong on this though)
Originally posted by PAUL9
NickP,
Can you post a chart of volume profile based on the Week?
maybe that would show something.
(I don't have volume profile abilities or I would do it myself)
Thanks for the chart, NickP
When I looked at your VP for the week, it looks like the 42 area is at the edge of the bell. Doesn't Bruce say that he expects that if price visits the edge of the bell it can move toward the fullest part of the bell?
42 area could appeal to straight price readers, too.
Week ending July 6 had a Low of the Week of 1342.50. If bulls are really in command right now, they should defend the 42 and try to fill the gap from Friday's H (53.25) up to the the 7-5 close of 61.50 (or at least a test of the L created 7-5 which was 57.00
and remember, this might only be another entry on the long long list of things Paul got wrong.
Originally posted by NickP
Hey Bruce, was wondering abt the volume levels you posted. Here is my market profile/vol chart from friday (dtn-iq data btw)
I am not showing strong volume in the 42.25-44.5 area as u mentioned, just some volume and a low vol zone in that area. Strong volume for me came in the 51-51.5 area, with 45.5 and 48.5 fighting for the silver medal
double checked my data with ib and seems to agree so i am little confused as to what r u seeing in that 42.25-44.5 area
thanks
Originally posted by BruceM
Great stuff Big Mike....that was huge volume on Friday that came in at 1342.25 - 1344.50 and critical support as you already show...I also have the 48.50 from friday but volume wasn't as strong there....thanks for that chart!!
How is the Ib strategy working ?
FWIW, my 42-43 level is significant price action S/R level, not volume related, for me at least.
Originally posted by rburns
Sorry but I was not aware that there is a stretch calculation daily on this site. Can some one pls point me to it
http://www.mypivots.com/dailynotes
Emini Day Trading /
Daily Notes /
Forecast /
Economic Events /
Search /
Terms and Conditions /
Disclaimer /
Books /
Online Books /
Site Map /
Contact /
Privacy Policy /
Links /
About /
Day Trading Forum /
Investment Calculators /
Pivot Point Calculator /
Market Profile Generator /
Fibonacci Calculator /
Mailing List /
Advertise Here /
Articles /
Financial Terms /
Brokers /
Software /
Holidays /
Stock Split Calendar /
Mortgage Calculator /
Donate
Copyright © 2004-2023, MyPivots. All rights reserved.
Copyright © 2004-2023, MyPivots. All rights reserved.