ES Tuesday July 24th
ES set to open in the value area from Monday and the Overnight range is bounded by the day session value area too. Look to fade extremes and target the middle of the value area from yesterdays RTH session.
Above yesterdays Highs I have 53.50 and then 57 .
Above yesterdays Highs I have 53.50 and then 57 .
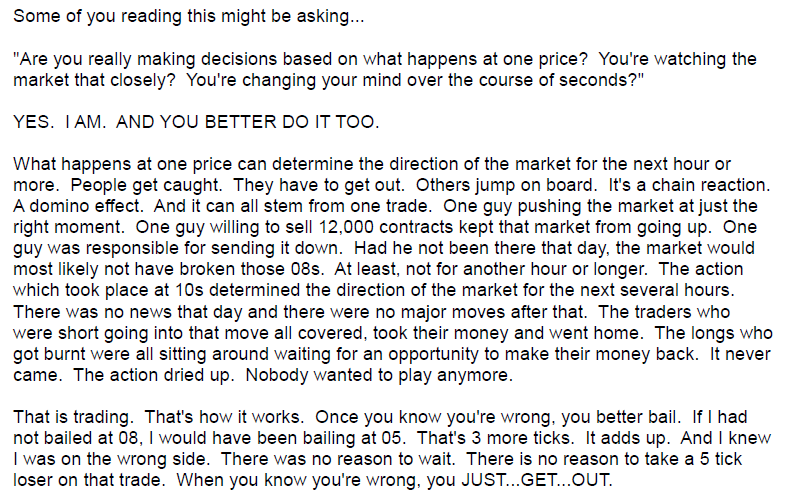
not sure if anyone is left here today but I thought I'd wrap up with a quote from the the www.nobsdaytrading.com course..
If anyone has taken his more in depth seminar/webinar then I'd like to hear some feedback either here or privately. This guy trades only from his DOM and seems like the real deal. The point I'm making with this is that most days there are only 3- 4 spots where big money comes in so it pays to know what is going on around those spots.
Click image for original size
If anyone has taken his more in depth seminar/webinar then I'd like to hear some feedback either here or privately. This guy trades only from his DOM and seems like the real deal. The point I'm making with this is that most days there are only 3- 4 spots where big money comes in so it pays to know what is going on around those spots.
24 it is !
Originally posted by NickP
good trade bruce, was with you from 26.25, just could not post...answering some PMs and so on...28.25 and 30.5 were targets for me so flat now
that 26-28.5 area has been solid, but a trip down to 24 could be in the cards before the day is voer i guess, and below that comes that 19-20ish
everything worked beautifully today...so officially done for the day...good luck
Thanks for the link, Bruce. He writes funny. I liked the following quote
"The market is still going to go down because Mr. G. Money from Wall Street is going to hammer the market by selling 10,000 contracts and he doesn't care if it doesn't break because he made his firm thirty million last year so **** you, he's selling and if you have the balls to buy 20,000 contracts and try to bid it up then do it, bitch."
"The market is still going to go down because Mr. G. Money from Wall Street is going to hammer the market by selling 10,000 contracts and he doesn't care if it doesn't break because he made his firm thirty million last year so **** you, he's selling and if you have the balls to buy 20,000 contracts and try to bid it up then do it, bitch."
he's a bit crude..I fired up his presentation that comes with his ebook and my ten year old was there and the first words are like "welcome to the no bull**** trading course"
so i watched it later that day without him around just in case it got worse......it didn't get worse but that DOM trading is tricky stuff and you need good eyes..
so i watched it later that day without him around just in case it got worse......it didn't get worse but that DOM trading is tricky stuff and you need good eyes..
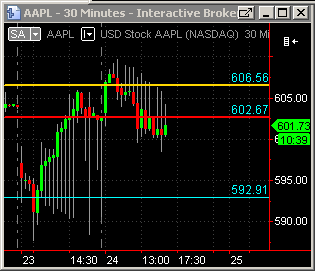
$SPX here is at its 50MA on daily
Nick - u r on fire today...great work !!
thanks ! gap in the data left below at 29.25
WTF is going on?
In words of that guy from "no BS trading"
"trade THAT, bitch!"
"trade THAT, bitch!"
bloomberg...
Emini Day Trading /
Daily Notes /
Forecast /
Economic Events /
Search /
Terms and Conditions /
Disclaimer /
Books /
Online Books /
Site Map /
Contact /
Privacy Policy /
Links /
About /
Day Trading Forum /
Investment Calculators /
Pivot Point Calculator /
Market Profile Generator /
Fibonacci Calculator /
Mailing List /
Advertise Here /
Articles /
Financial Terms /
Brokers /
Software /
Holidays /
Stock Split Calendar /
Mortgage Calculator /
Donate
Copyright © 2004-2023, MyPivots. All rights reserved.
Copyright © 2004-2023, MyPivots. All rights reserved.