ES Wednesday 8-29-12
a brief video of some things I am watching today. Key thing will be to see if volume can enter the market to break price away from the 1408 - 1410 area. We don't usually form inside weekly bars but so far we are trading inside last weeks range. Trend traders will try to get one of those extremes if they can so we can only fade extremes for so long until the rubber band of volatility snaps and we don't mean revert any longer...
good luck today
good luck today
Thanks for the video, Bruce
It is so much easier for me to learn from seeing the chart than it would be if you had just offered a description.
BTW, 50% of last week's range is...drumroll please...1410.13 (RTH prices only)
This morning, well after your video was posted, in the RTH, price dropped to print near that 1407 area you had mentioned (actual low print was 1406.75 at the 10:01am bar. Is there anything you look for in your footprint charts to initiate a long position for a bounce?
I know you had said in the video that you expected 1408-1410 area to be a magnet and that fading extremes AWAY from that area was a trading plan, but is there a volume clue that boosts confidence to play long?
Here is why I ask about a volume clue in the very short-term test of the 1407 for a long...
I assume you played that for a long and were happy to get out once the magnet zone was printing. If that is the case, was there a volume cue that boosted your confidence for the bounce play?
for that matter, was there a volume clue in the magnet zone (08 to 10) that might have inspired a short-play (I know you had the lower 1404 handle on your radar)
Other:
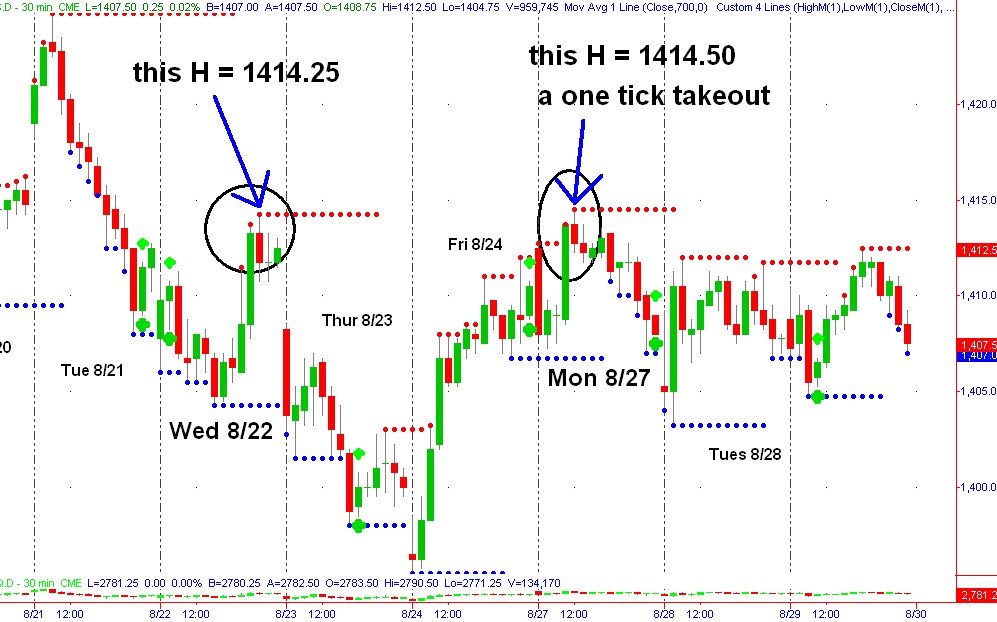
One thing that bothers me (prevents me from execting upside) right now is that price has NOT been able to have a daily close above 50% of last week's range. Let's face it, in RTH trading, if you look at a 30min chart, on Monday, the HOD was a test and rejection of the swing H failure from Wednesday of last week. and Tuesday of this week price once again was unable to have a close above 50% of the prior week's range.
It is so much easier for me to learn from seeing the chart than it would be if you had just offered a description.
BTW, 50% of last week's range is...drumroll please...1410.13 (RTH prices only)
This morning, well after your video was posted, in the RTH, price dropped to print near that 1407 area you had mentioned (actual low print was 1406.75 at the 10:01am bar. Is there anything you look for in your footprint charts to initiate a long position for a bounce?
I know you had said in the video that you expected 1408-1410 area to be a magnet and that fading extremes AWAY from that area was a trading plan, but is there a volume clue that boosts confidence to play long?
Here is why I ask about a volume clue in the very short-term test of the 1407 for a long...
I assume you played that for a long and were happy to get out once the magnet zone was printing. If that is the case, was there a volume cue that boosted your confidence for the bounce play?
for that matter, was there a volume clue in the magnet zone (08 to 10) that might have inspired a short-play (I know you had the lower 1404 handle on your radar)
Other:
One thing that bothers me (prevents me from execting upside) right now is that price has NOT been able to have a daily close above 50% of last week's range. Let's face it, in RTH trading, if you look at a 30min chart, on Monday, the HOD was a test and rejection of the swing H failure from Wednesday of last week. and Tuesday of this week price once again was unable to have a close above 50% of the prior week's range.
Sorry.
I cannot figure out why my chart won't post.
maybe I've been banned from posting charts but no one told me so.
I cannot figure out why my chart won't post.
maybe I've been banned from posting charts but no one told me so.
Paul, I think there are only a few basic footprint patterns that sometimes offer a clue but we can NEVER be sure of anyones true buying or selling plans. The best we can is take the trade and use a stop for when we get it wrong.
With that said, I saw the volume histogram building out SLIGHTLY on the right side of my screen which told me that somebody MIGHT be secretly hiding their buying intentsions. The other thing I am watching for is increased trade on the bid side in hopes that at key areas and lows that some aggressive sellers might be getting trapped as they joined the selling too late and will need to unwind and to exit...so they exit to help drive price up a bit.
I also think something else take place at key lows and highs and that is that we see some kind of air pocket BEFORE you see a bigger volume node..this implies to me that some smarter folks drove price lower without any of us mere mortals even noticing the selling ..then when I see the volume node at the bottom it tells me that MAYBE this volume node isn't really additional sellers at the lows but just those folks covering their shorts from higher prices. Which helps drive price back up. So they secretly sold to create the air pocket and then the volume comes in when they cover. This would be classic air pocket behavior...
so the CONTEXT is always critical ....this video is just to explain the concept as I have not yet embraced reversal charts...I just couldn't find any other way to describe what I am thinking..hopefully this isn't too much of a stretch
Bruce, thanks for the 2nd video, seems subject to interpretation, but what isn't.
DT,
here's one more try for that chart of 30minute RTH only bars showing this week's test of LAST week's swing high failure.
DT,
here's one more try for that chart of 30minute RTH only bars showing this week's test of LAST week's swing high failure.
Click image for original size
DT,
I'm a moron, tried and true.
As I was going through the paces of posting the chart I realized that in previous attempts, I probably had forgotten to hit the UPLOAD button after identifying the file. (easy to do because after I had identified the .jpg and it's path was sitting in the file name box, I must have just looked to the bottom of that page to see ''Post New Reply'' without ever having hit the "Upload" radio button after identifying the file. ooooops
Emini Day Trading /
Daily Notes /
Forecast /
Economic Events /
Search /
Terms and Conditions /
Disclaimer /
Books /
Online Books /
Site Map /
Contact /
Privacy Policy /
Links /
About /
Day Trading Forum /
Investment Calculators /
Pivot Point Calculator /
Market Profile Generator /
Fibonacci Calculator /
Mailing List /
Advertise Here /
Articles /
Financial Terms /
Brokers /
Software /
Holidays /
Stock Split Calendar /
Mortgage Calculator /
Donate
Copyright © 2004-2023, MyPivots. All rights reserved.
Copyright © 2004-2023, MyPivots. All rights reserved.