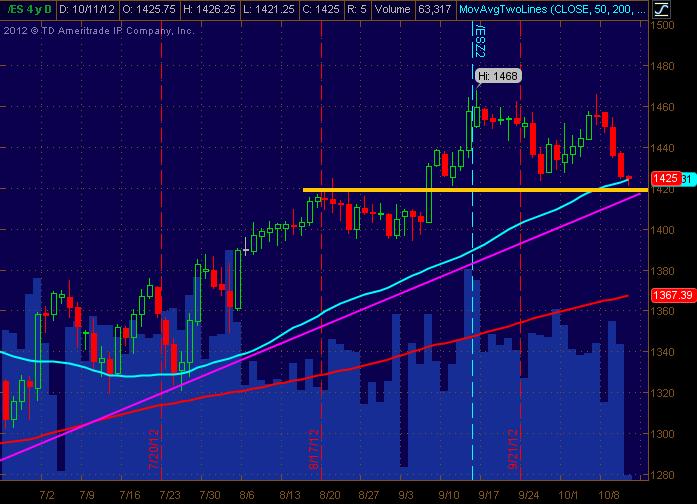
ES Thurs 10-11-12
The OBVIOUS on Daily ES chart ... a pullback into a tight ZONE of Support (yellow line), 50 Day SMA (cyan), and upward sloping Trendline (Magenta). Seems too obvious of a support area, but is worth watching thru that prism. The only contra to that is that there's a short term Double Top type formation at the same high from several years back. Didn't do anything xtra like fib analysis etc. But just wanted to post a bigger pic of what's going on hoping it helps ... just a "map" of things. Zone is 1415-1425 as potential support ... that could turn into a sideways trading range between 1425-1465. Next support zone down if broken looks like 1390-1395.
Earnings season and Thurs reports may well "jank" things around. Depending on the overnight session, I'm looking at buying calls fwiw.
Click image for original size
Earnings season and Thurs reports may well "jank" things around. Depending on the overnight session, I'm looking at buying calls fwiw.
no..those options are a dud...I guess there is more time decay than I thought and just closed them out at a loss... a big loss too if you look at what i paid versus what I sold that at ......20 cents ..yikes....
air pocket being filled in for those on the shorts
air pocket being filled in for those on the shorts
us shorts need this stay under the IB high and the O/N high to have any chance at that 30 - 31 area...that will also make us neutral if we get out under IB low...so I am basically looking at 37 - 37.50 as the key point I don't want to see again up top...
we are approaching the second test of the death zone I mentioned in the video ..lets not forget where many of these zones come from...usually a previous days or weeks high or low...last weeks low is 1432.25.....so they are digesting that still...
personally I do not like the entire 33 - 29 area...just too many numbers showing up in there and I'm scaled way off here and will not try the long over lunch in here ..volume way off now too
we have gone just about equal amounts on both sides of the IB....so no good ideas for me
personally I do not like the entire 33 - 29 area...just too many numbers showing up in there and I'm scaled way off here and will not try the long over lunch in here ..volume way off now too
we have gone just about equal amounts on both sides of the IB....so no good ideas for me
Emini Day Trading /
Daily Notes /
Forecast /
Economic Events /
Search /
Terms and Conditions /
Disclaimer /
Books /
Online Books /
Site Map /
Contact /
Privacy Policy /
Links /
About /
Day Trading Forum /
Investment Calculators /
Pivot Point Calculator /
Market Profile Generator /
Fibonacci Calculator /
Mailing List /
Advertise Here /
Articles /
Financial Terms /
Brokers /
Software /
Holidays /
Stock Split Calendar /
Mortgage Calculator /
Donate
Copyright © 2004-2023, MyPivots. All rights reserved.
Copyright © 2004-2023, MyPivots. All rights reserved.