ES 3-05 LEDGE alert
YM and NQ showing relative weakness now ( ES on new highs and others aren't)and we have a big ledge at 38.75 in the ES...we owe it to ourselves to stay off longs at these new highs I think....
I certainly could be wrong and have been many times but the probabilities are for that ledge to be run out today
lower risk traders will wait till we get back below the 41.50 high to hunt for shorts
May the trade be with you !!
I certainly could be wrong and have been many times but the probabilities are for that ledge to be run out today
lower risk traders will wait till we get back below the 41.50 high to hunt for shorts
May the trade be with you !!
damn...we truly are abandoned here....that was ALMOST perfect...don't be a pig !
I go in peace back to my cave !
I go in peace back to my cave !
Thanks for posting Bruce,
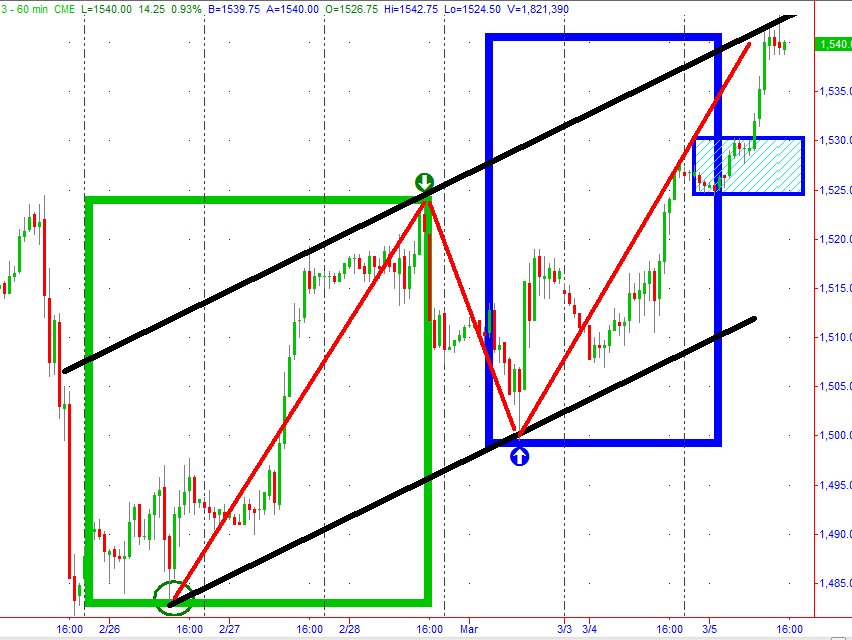
I have a couple of minutes and I thought I'd take the time to let people know that Channels and Measured Moves really can unfold in the markets.
The chart is less complicated than you think
See the red lines; there are 3. First red line (from left to right) starts at a Low and ends at a High (high marked by a green arrow down).
That first red line represents the high and Low of the green box. I use the rectangular box as a quick and easy way to 'measure' the run up.
See the second red line that moves down from the green arrow? That is the length of the retracement of the first move. I don't really care about what % that retracement of the first leg up represents, I just want to see the retracement Low (marked by the Blue up arrow).
I then copy the green box and grab the new box and move it on the chart so that the bottom of the rectangle is at the retracement low. Then, the top of the box would represent the price level of a measured move. (take a lot less time to slam it onto the chart than it does to explain the mechanics of getting it on the chart.)
I changed the color of the copy box to blue and I did squeeze it from side to side a little, but the real purpose of the box is to see where the measured move projects. roughly 1541.
The measured move was the reason for the boxes and the projection, but it just so happens that the two marked lows and the top of the first leg up (marked by green down arrow) also define an UP CHANNEL.
The little box with the hatch marks in it on the far right side of the chart is the first area of price congestion below the current sideways consolidation.
If this market is going to fall apart it should start near 2:30 ET But one thing I have to say, one of the stronger moves that you can have is a an Unfilled Gap Up. Many times weakness in the afternoon can bottom near 3:15 and then all the bears who refused to exit at a loss can run in and be satisfied with anything that was lower than the day's H, and in a perverse fashion can actually lift prices if they panic to close out short positions by buying.
Click image for original size
Hey Bruce,
I voted for you.
LOL
I voted for you.
LOL
Thanks Paul...at least we are here and voting...I'm gonna vote back at ya.....!
Your 41 projection went well with 1.5 times the IB which was/is 42...two different projection techniques with similar results ..how cool was that...then we throw in that divergence of the other markets and we have a good idea to work from with that ledge below as a magnet.....
Your 41 projection went well with 1.5 times the IB which was/is 42...two different projection techniques with similar results ..how cool was that...then we throw in that divergence of the other markets and we have a good idea to work from with that ledge below as a magnet.....
single prints at 36.75 so if anyone was still trying to be short you may want to watch out if they come down to that....
50% back is down here too
50% back is down here too
cool how the Nq traded back to it's single print but not YM or ES..
there are some who say traditional Mp doesn't work anymore....I say HOGWASH - we need to utilize the best of all ideas and not assume that any one particular discipline is the be all - end all !!
Now Johnny Walker is calling me.....a bad start for me today but a good finish...hope it went well for any one still here reading these.
I shorted the e-mini at 1540.50 on the last rally.
I covered at 1540.25
Emini Day Trading /
Daily Notes /
Forecast /
Economic Events /
Search /
Terms and Conditions /
Disclaimer /
Books /
Online Books /
Site Map /
Contact /
Privacy Policy /
Links /
About /
Day Trading Forum /
Investment Calculators /
Pivot Point Calculator /
Market Profile Generator /
Fibonacci Calculator /
Mailing List /
Advertise Here /
Articles /
Financial Terms /
Brokers /
Software /
Holidays /
Stock Split Calendar /
Mortgage Calculator /
Donate
Copyright © 2004-2023, MyPivots. All rights reserved.
Copyright © 2004-2023, MyPivots. All rights reserved.