ES 5-3-13
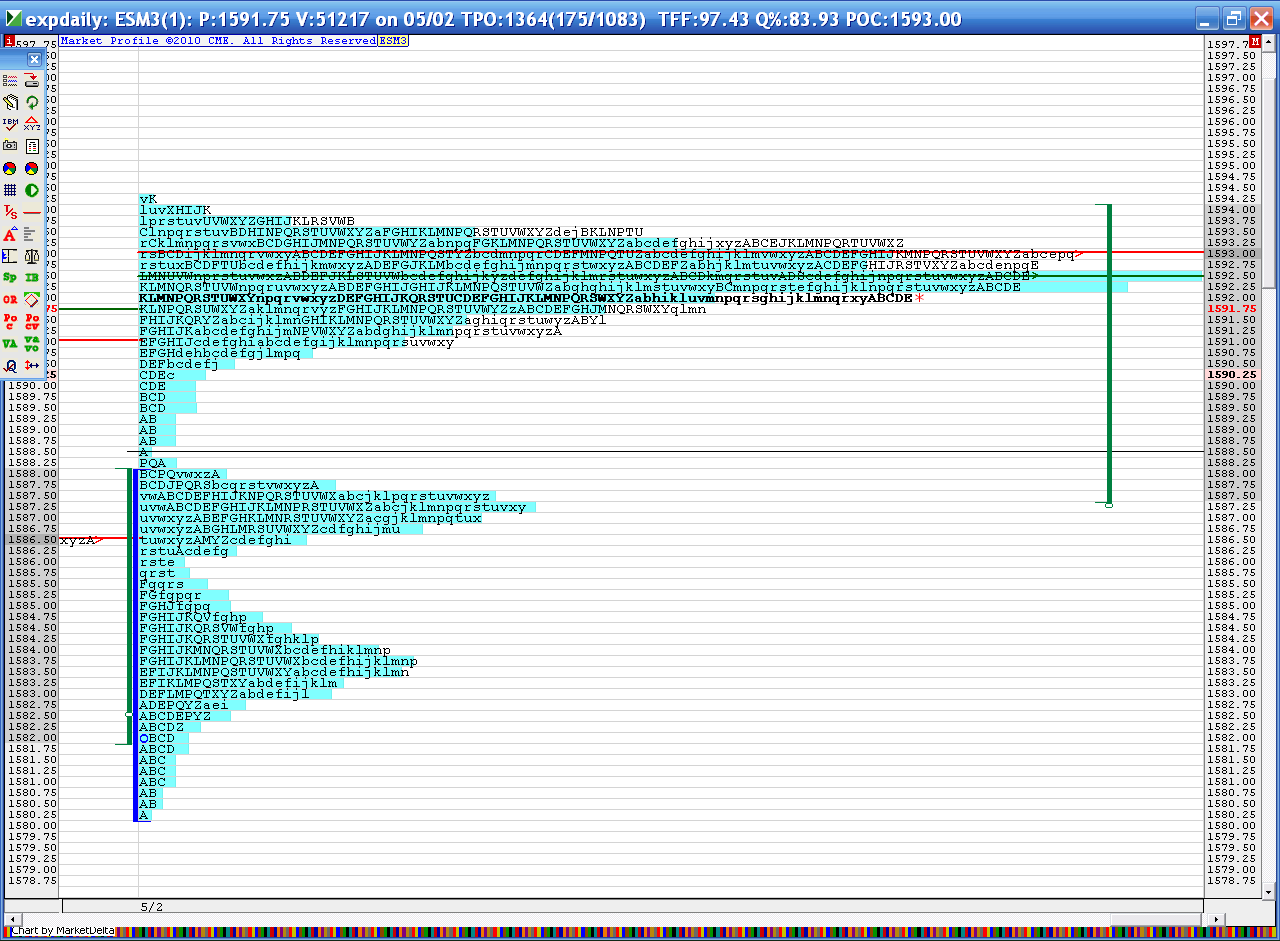
The super secret chart from yesterdays day session.
87 - 88 and the 92.50 are the biggest numbers to watch. Report at 8:30 may change all this.
There is also a low volume area and single print at 85.75...so if we open in Value and drop down we have two key buy points. Or just snap a line at 86 - 88 and use that as a zone
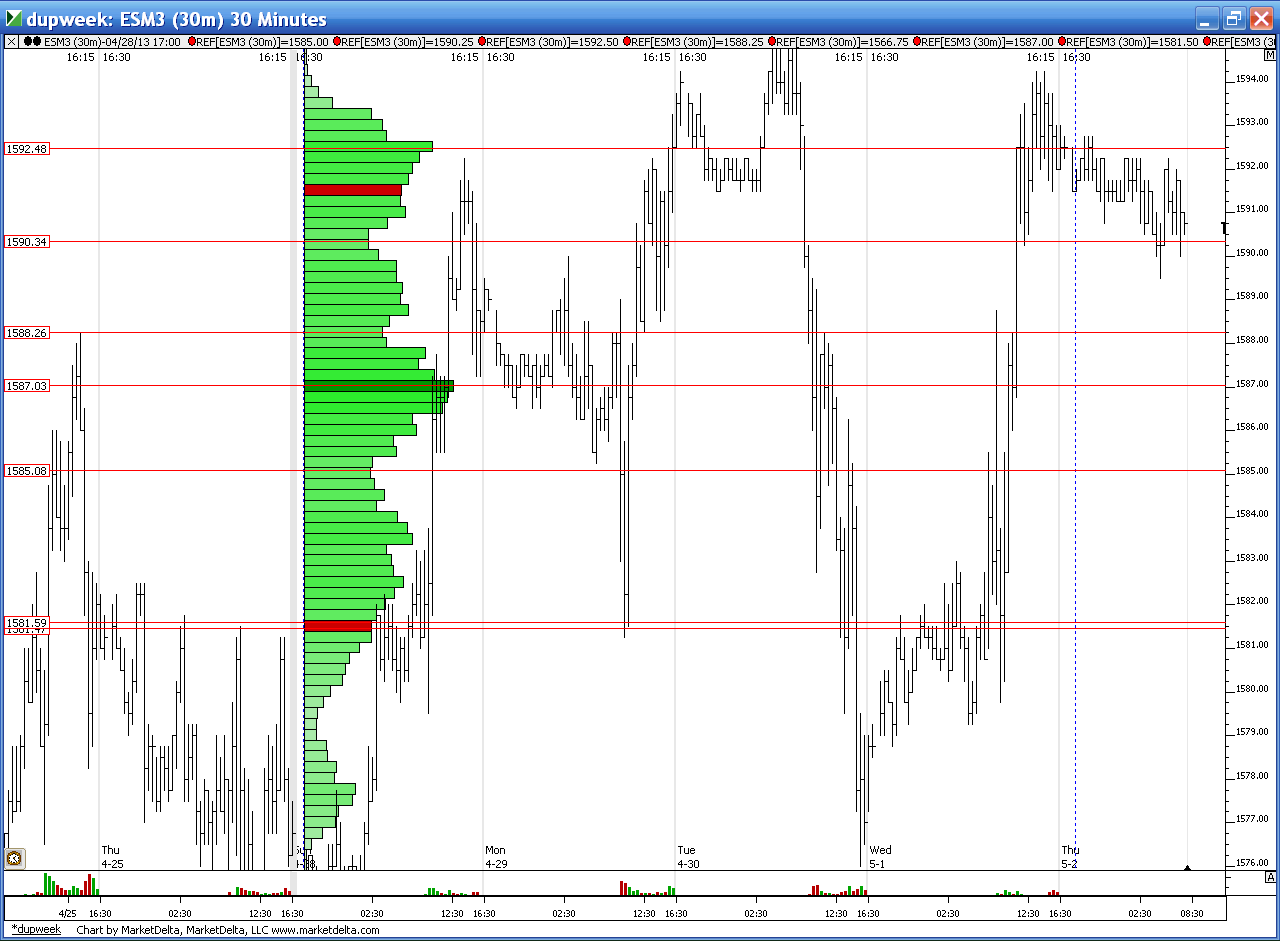
here is how the weekly looks so far..note the low / high volume combination at 87 - 88.25 this week..
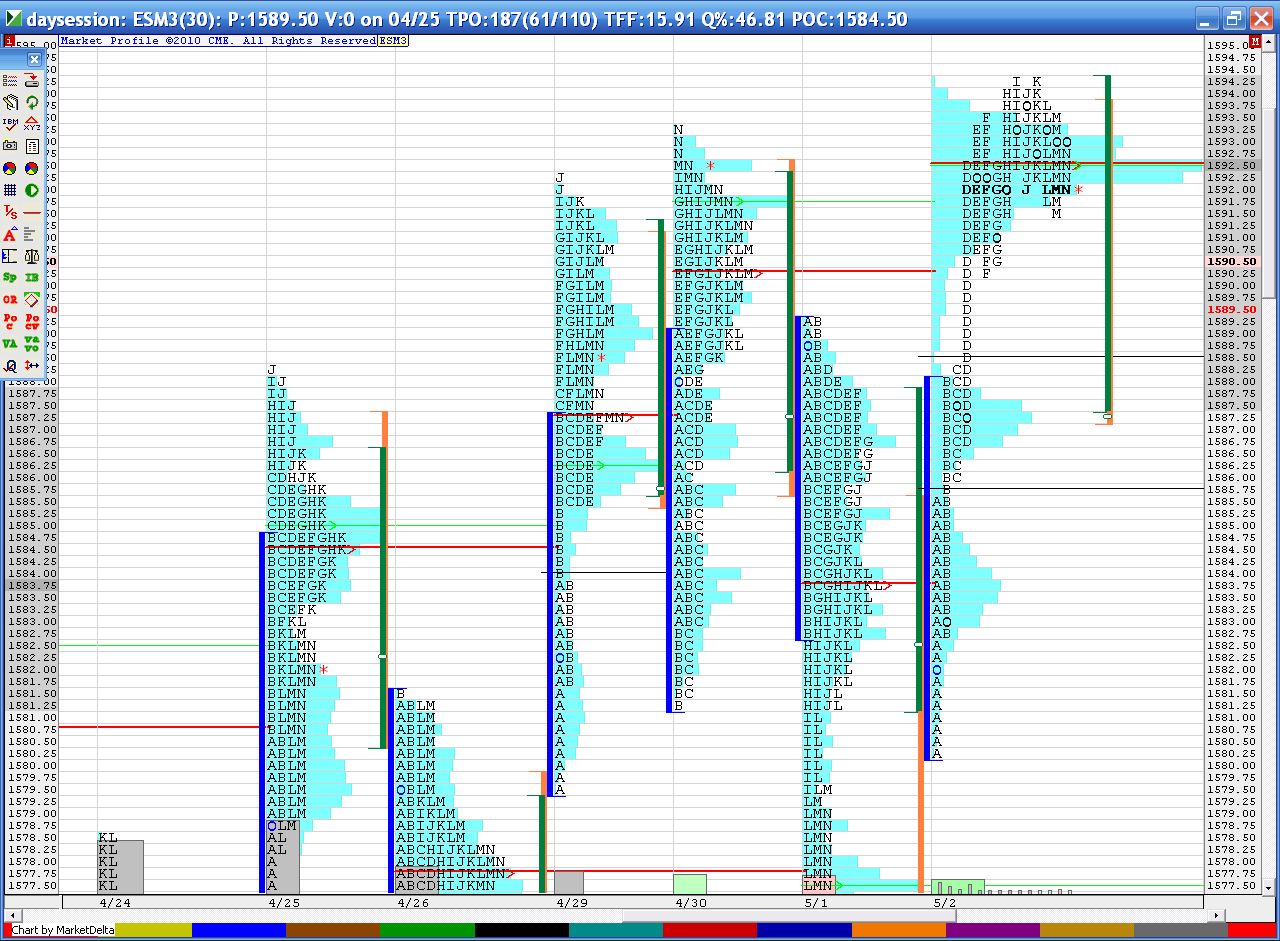
and here is traditional MP chart
87 - 88 and the 92.50 are the biggest numbers to watch. Report at 8:30 may change all this.
There is also a low volume area and single print at 85.75...so if we open in Value and drop down we have two key buy points. Or just snap a line at 86 - 88 and use that as a zone
Click image for original size
here is how the weekly looks so far..note the low / high volume combination at 87 - 88.25 this week..
Click image for original size
and here is traditional MP chart
Click image for original size
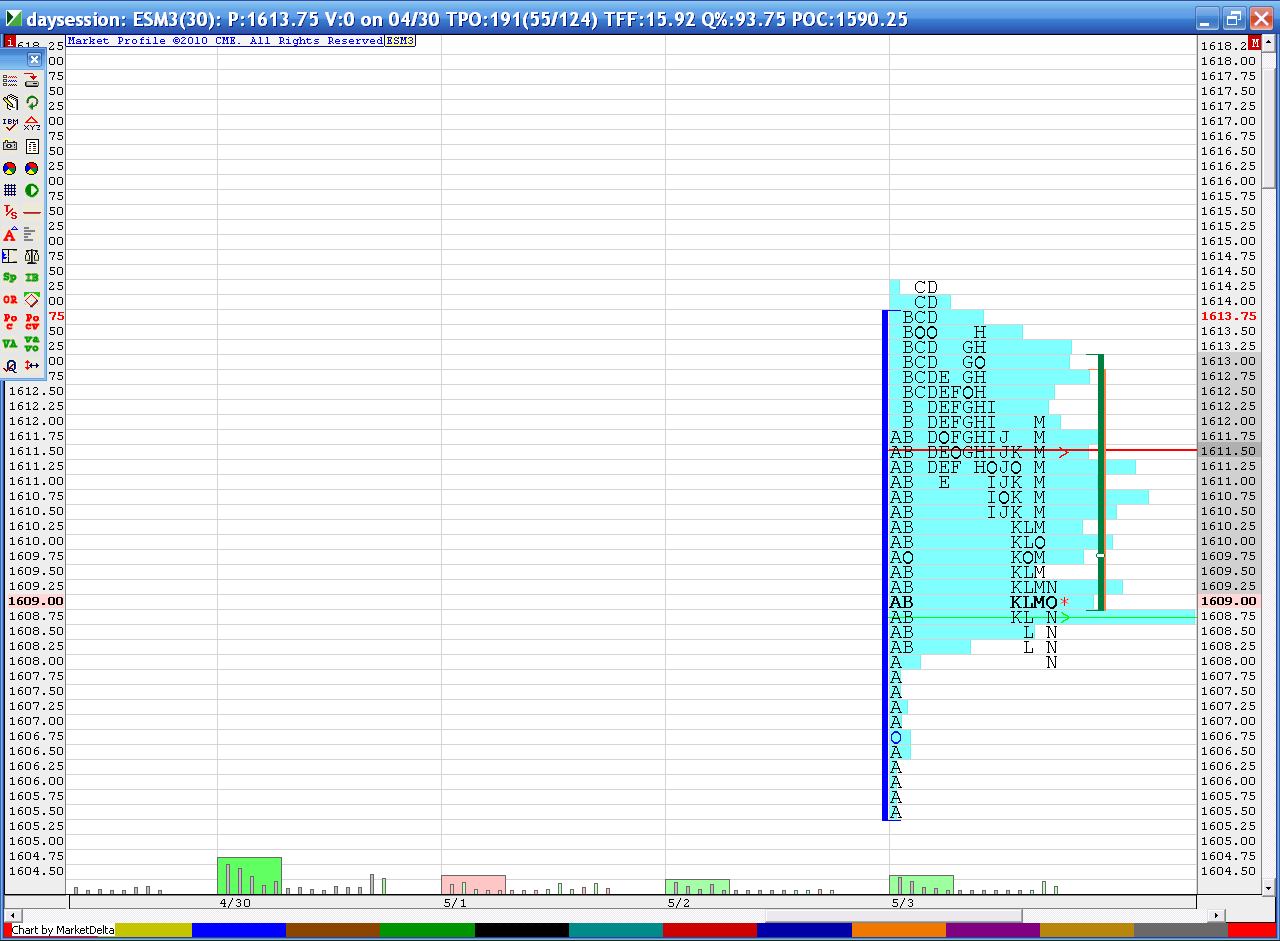
I like the concepts you and Thomas are talking about. The only thing that concerns me is that we have a poor high from Friday - Look at that double top in "C" and "D" periods...that doesn't show aggressive sellers. The other concern is that the Monthly R1 level comes in exactly at 1614.25 and look where Fridays high is.
Hopefully the overnight session will give us some clues.
Here is a quick look at that double top
Hopefully the overnight session will give us some clues.
Here is a quick look at that double top
Originally posted by aumadvisor
Just curious of everyone's thoughts, but in my mind the chart from Friday looks promising to set up an island pattern. We have a huge runup with high volume and rounds out on the top. If Sunday opens with a gap down I think we have a good chance of hitting 92.5 as early as mon, Tuesday at the latest. Bull and bear swings typically end with a sign of "excess" such as this. This week should be interesting.
Click image for original size
Emini Day Trading /
Daily Notes /
Forecast /
Economic Events /
Search /
Terms and Conditions /
Disclaimer /
Books /
Online Books /
Site Map /
Contact /
Privacy Policy /
Links /
About /
Day Trading Forum /
Investment Calculators /
Pivot Point Calculator /
Market Profile Generator /
Fibonacci Calculator /
Mailing List /
Advertise Here /
Articles /
Financial Terms /
Brokers /
Software /
Holidays /
Stock Split Calendar /
Mortgage Calculator /
Donate
Copyright © 2004-2023, MyPivots. All rights reserved.
Copyright © 2004-2023, MyPivots. All rights reserved.