Foliage's E-Mini NQ100 trading system
http://www.collective2.com/cgi-perl/systems.mpl?session=1806120558510333256636390093&want=publicdetails&systemid=17894465&fromoutside=1&donealready=1
C2 rank list:
http://www.collective2.com/cgi-perl/newsearch.mpl?want=all&session=47585529117521092135066799110662783
This is a computer auto trade system.
This system only trades Emini NQ100.
Buy or short after market open(around 9:30AM EST)
Sell or cover before market close(around 16:00PM EST)
Backtest from Mar. 10th, 1999 to Jan. 19th, 2006.
Capital increase percentage based on average NQ price.
On yearly1 chart:
Red line shows the trades on C2 from 01/20/2006 to 02/06/2006
I trade 40 contracts every time, assume average NQ price is
$1700, profit $52000, capital = 1700 * 40 = 68000
Capital increasement = 52000/ 68000 = 76%
On the following chart, it is about 83% because I use average NQ
price is $1565.5 from 2005 -01-01 to present
Lost trades:(My fucntion get_last_quote() has a small bug,
there are three days can not go to C2 although my system
send a signal. I keep narrowing the line range for this bug)
long 40 @NQH6 1693 2006-01-24 09:31 sell 1696.5 2006-01-24 15:58
short 40 @NQH6 1719 2006-02-02 09:31 sell 1695 2006-02-02 15:58
long 40 @NQH6 1675 2006-02-08 09:31 sell 1680 2006-02-08 15:58
There is one thing I need to mention here:
If I do not set up stop loss limit, I can earn more 20% percent every
year. But I use stop loss limit in case some thing like 911 happens
during my trading time.
If you can want to earn more, you may increase the stop loss range
several points than mine. I will public my stop loss limit for every
trade on C2.
I confess (and apologize) that I completely forgot to switch on the IM today - I have set myself an automatic reminder for the rest of the week so hopefully will be able to post something useful here tommorow.
Foliage: What a third party web site like C2 reports is not necessarily what you can expect in the real world even if you use their realism factor. I started posting a strategy on C2 a long time ago and immediately stopped becuase the results being reported on C2 were way better than the real results. This could have been a temporary bug in the C2 system because I never followed it up to discover why it happened (I don't have time to debug other people's software - I believe that they should debug it themselves) - the end result is that you have to be able to see how profitable you would be using this system.
It may be a very profitable system but some people may be unable to trade it. Say for example that most of the profitable trades were initiated between 2 and 2:30pm and that you had to pick your kids up from school at this time... Might be a great system but you can't trade it because of personal constraints - this is just an example but is something that needs to be considered for each person and is not a criticism of any system - and this is why you do free trials etc.
I kept the IM running all day today but there weren't any alerts and I notice that there weren't any alerts yesterday either.
At a quick glance it looks like the system trades every 3 to 5 days.
Foliage: How long before the the entry does a message get sent out?
At a quick glance it looks like the system trades every 3 to 5 days.
Foliage: How long before the the entry does a message get sent out?
quote:
Originally posted by daytrader
I kept the IM running all day today but there weren't any alerts and I notice that there weren't any alerts yesterday either.
At a quick glance it looks like the system trades every 3 to 5 days.
Foliage: How long before the the entry does a message get sent out?
From backtest result, there is 132 trades in year 2005, 116 in year2004,
103 trades in year 2004.
My trades open around 9:33AM(EST), close around 15:58PM
If there is no trade before 9:36AM, go away!
Lost trades:(My fucntion get_last_quote() has a small bug,
there are three days can not go to C2 although my system
send a signal. I keep narrowing the line range for this bug)
long 40 @NQH6 1693 2006-01-24 09:31 sell 1696.5 2006-01-24 15:58
short 40 @NQH6 1719 2006-02-02 09:31 sell 1695 2006-02-02 15:58
long 40 @NQH6 1675 2006-02-08 09:31 sell 1680 2006-02-08 15:58
So there 10 trades in last 19 trade days.
My question was: How long before the trade gets executed does the IM message or email get sent out? i.e. How much time do you need between sending out the singal and executing the trade?
quote:
Originally posted by daytrader
My question was: How long before the trade gets executed does the IM message or email get sent out? i.e. How much time do you need between sending out the singal and executing the trade?
I post my command at 9:33Am, while I can see C2 trade record at 9:33AM. I check my email sent by C2 in my Yahoo account,
Most of them are at 9:33AM, one is at 9:34AM. I do not use ITM,
but I assume it should be faster than email.
My system is not time sensitive. It is oaky even your trade is
several minutes late than my trade. My system average trade
length is around 6.5hours.
The largest market capital is Forex,
the second is EMINI S&P 36B
the third is EMINI NQ 9B
the forth is QQQQ 3.3B
http://www.cme.com/trading/prd/equity/eminivsetf.html
So your system waits for the open price and then generates a signal which is for a trade that runs from open until close that day?
quote:
Originally posted by daytrader
So your system waits for the open price and then generates a signal which is for a trade that runs from open until close that day?
Yes, but not only open price. I have a very good buy or short model.
If all input parameters meet fit my model. A trade signal is
triggered. You will find that my system likes to win large profit,
and lose small per trade.
In fact, I can send out win lose ratio for every day, if win ratio >
70%, my system will send out a signal, buy or short.
Sounds interesting. I'll keep an eye out for the signals. None so far this week.
Just got this email from you at 12:12pm:
quote:
I am very sorry for you guys.
My quote tools --"QuoteTracker" was dead, my system missed a
short signal this morning. I want to use Quotetracker to unify
my interface to different quotesource, if it can not work well. I will
use Broker API directly, and discard quotetracker.
This is the fourth lost trade so far.
I received the following email from your system on Friday 2/24 just before 5pm EST. (i.e. after the markets were closed.) It appears that there was an open order at the market open on Friday and the signal failed to go out and then there was a close order sent out by email at about 4pm EST on the same day. Is this right? Although your system appears to have good results it also appears that the technology to send out the signal is not available to your system yet?
quote:
I changed my password for C2, but I forgot to update the the password in my C++ code for opening trade, so the long did
not go to C2, but the sell order went to C2. It is only around 2
points. You do not lose much profit. This is 100% computer
auto trade system, it is very large. So I need some to make it
work perfectly. Thank you very mcuh for your patience.
After I sent the long order to C2, then I sent the same signal to
a Chinese forum. Today's long order was sent to the follwoing link
successfully.
http://www.armleg.com/forum/viewtopic.php?t=89&mforum=investmentelite
02242006 06:33
buy @NQH6 at market
Stop loss = 17 points
Length of holding period: 6.5 hours
(It is PST for 06:33)
This is a Chinese Forum. After you sign up and get aproved,
you can see this order.
My system did not have signal for the last week. It could not
send a short on this Tuesday for Quot! eTracker is dead. It is
around 20 points profits. My system will continue to send out
a signal to make profits when the buy or sell model is met.
I appreciate for you supporting my system.
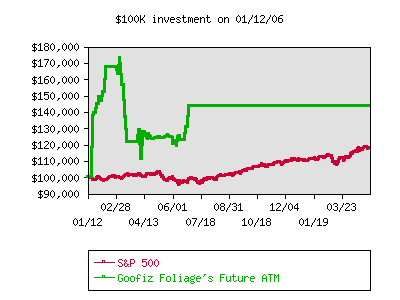
My last comment on this trading system was made on 04/05/2006 and the last trade that was opened/closed on the system was 06/23/2006 - about 10 weeks later. The system lost more money after my last post but subsequently recovered some. There does not appear to be a reason given for the system no longer being active.
Here is the equity curve of the system.
Here is the equity curve of the system.
Click image for original size
Emini Day Trading /
Daily Notes /
Forecast /
Economic Events /
Search /
Terms and Conditions /
Disclaimer /
Books /
Online Books /
Site Map /
Contact /
Privacy Policy /
Links /
About /
Day Trading Forum /
Investment Calculators /
Pivot Point Calculator /
Market Profile Generator /
Fibonacci Calculator /
Mailing List /
Advertise Here /
Articles /
Financial Terms /
Brokers /
Software /
Holidays /
Stock Split Calendar /
Mortgage Calculator /
Donate
Copyright © 2004-2023, MyPivots. All rights reserved.
Copyright © 2004-2023, MyPivots. All rights reserved.