Foliage's E-Mini NQ100 trading system
http://www.collective2.com/cgi-perl/systems.mpl?session=1806120558510333256636390093&want=publicdetails&systemid=17894465&fromoutside=1&donealready=1
C2 rank list:
http://www.collective2.com/cgi-perl/newsearch.mpl?want=all&session=47585529117521092135066799110662783
This is a computer auto trade system.
This system only trades Emini NQ100.
Buy or short after market open(around 9:30AM EST)
Sell or cover before market close(around 16:00PM EST)
Backtest from Mar. 10th, 1999 to Jan. 19th, 2006.
Capital increase percentage based on average NQ price.
On yearly1 chart:
Red line shows the trades on C2 from 01/20/2006 to 02/06/2006
I trade 40 contracts every time, assume average NQ price is
$1700, profit $52000, capital = 1700 * 40 = 68000
Capital increasement = 52000/ 68000 = 76%
On the following chart, it is about 83% because I use average NQ
price is $1565.5 from 2005 -01-01 to present
Lost trades:(My fucntion get_last_quote() has a small bug,
there are three days can not go to C2 although my system
send a signal. I keep narrowing the line range for this bug)
long 40 @NQH6 1693 2006-01-24 09:31 sell 1696.5 2006-01-24 15:58
short 40 @NQH6 1719 2006-02-02 09:31 sell 1695 2006-02-02 15:58
long 40 @NQH6 1675 2006-02-08 09:31 sell 1680 2006-02-08 15:58
There is one thing I need to mention here:
If I do not set up stop loss limit, I can earn more 20% percent every
year. But I use stop loss limit in case some thing like 911 happens
during my trading time.
If you can want to earn more, you may increase the stop loss range
several points than mine. I will public my stop loss limit for every
trade on C2.
Received an email at 9:34 EST today. (I opened the email at 14:00 EST today but that is completely my fault and no reflection on the system.) Stated the following:
The entry figure give is very reasonable. If you look back at the NQ when the email was received then you will see that the market was rising and your fill would very likely be better than the quoted fill in this case.
NQ today has (so far) traded up to 1703.5 so worse case draw down is 12.0 points and 10.5 points shy of the stop if my math is correct. (This is, in my opinion, an enormous stop - but I'm not arguing with the strategy - just trying to document the signals to give an accurate lay person's assesment of its value.)
At the time of writing this at around 14:05 EST the trade was breaking even.
quote:
3/2/06 9:33
Likely fill @1691.50 09:34
Sell to open 40 contracts NQH6 (E-MINI NASDAQ 100 STK IDX MAR 2006)
Stop 1713.95
The entry figure give is very reasonable. If you look back at the NQ when the email was received then you will see that the market was rising and your fill would very likely be better than the quoted fill in this case.
NQ today has (so far) traded up to 1703.5 so worse case draw down is 12.0 points and 10.5 points shy of the stop if my math is correct. (This is, in my opinion, an enormous stop - but I'm not arguing with the strategy - just trying to document the signals to give an accurate lay person's assesment of its value.)
At the time of writing this at around 14:05 EST the trade was breaking even.
Today's trade closed at 1697.00 giving a loss of 5.50 NQ points.
Cumulative P/L since I started monitoring this:
-5.50 NQ points
Cumulative P/L since I started monitoring this:
-5.50 NQ points
Confusing email from Collective2 this morning. Looks like a sell and buy order together.
3/3/06 9:33 Likely fill @1685.50 09:34
Sell to open 40 @NQH6
E-MINI NASDAQ 100 STK IDX MAR 2006
@ stop 1709.13 DAY
3/3/06 9:33
Buy to close 0 @NQH6
E-MINI NASDAQ 100 STK IDX MAR 2006
@ stop 1709.13 DAY
Not 100% sure what to make of this but I am assuing that it is a sell order with a fill of approximately 1685.5 and a stop at 1709.
I checked the sell price against market prices and that sell price is reasonable.
Today's trade was stopped out at 1709.0 giving a loss of 24.5 NQ points.
Cumulative P/L since I started monitoring this:
-30.0 NQ points
There still seems to be an error in the software that sends out the alerts because I received an alert at 3:58pm which stated buy to close at market but this trade was stopped out way before that.
Cumulative P/L since I started monitoring this:
-30.0 NQ points
There still seems to be an error in the software that sends out the alerts because I received an alert at 3:58pm which stated buy to close at market but this trade was stopped out way before that.
On the collective2 web site it gives your open position as shown in this image: (today is 3/6/06)
This position should have been stopped out on Friday and not still open today?
Click image for original size
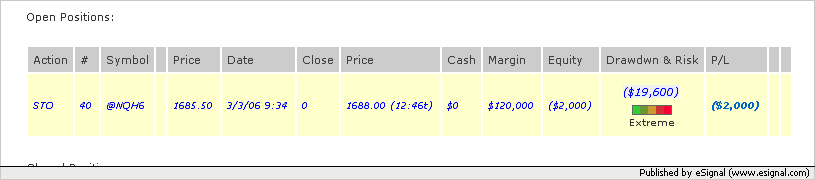
This position should have been stopped out on Friday and not still open today?
Today got the following email at the close:
3/6/06 15:58
Likely fill @1673 03:58
Buy to close 40 @NQH6
E-MINI NASDAQ 100 STK IDX MAR 2006 at mkt DAY
This basically says that it was a DAY trade - BUT I never received the open signal - only the close signal.
Also, when looking at the site this morning (as per the image in the previous posting) it does not look like Friday's trade was stopped out but carried through the weekend even though it was supposed to be a DAY trade as well.
Foliage: Any comments on what's happening with your system? What are you doing about the technical issues of getting the signals to people? What about these issues that I've brought up here about the stop not being recognized?
Okay - Emails from Collective2 are still very buggy. I picked this off the web which appears to be an accurate reflection about what happened today:
Emailed, trade filled @1666.50 (3/7/06 9:33) 3/7/2006 Buy to open 40 @NQH6 @ stop 1655.73 DAY
Emailed, trade filled @1655.73 (3/7/06 13:09) 3/7/2006 Sell to close 40 @NQH6 @ stop 1655.73 DAY
However, I received 2 emails at the open today (09:33) and no email when the trade was stopped out so I certainly would not rely on the email for alerts.
It looks like today's long was stopped for a loss of 10.5 NQ points
Cumulative P/L since I started monitoring this:
-40.5 NQ points (over 3 trades)
Today's trade is first winner since I started watching this - well done!
Open at 1659 and close at 1666 at end of day for a profit of 7.0 NQ points
Cumulative profit to date:
-33.5 NQ points (over 4 trades)
Folliage: Are you aware that the tick size in the NQ will change from 0.5 to .25 in about 3.5 weeks time? Have you made adjustments to your system yet to take that into account? If so, what have you done to your model to ensure that it continues to work as before?
Today's trade was a long open at 1664.0 and a stop at 1642 and resulted in the stop NOT being hit so the trade was closed out at the end of the day at 1647.50 for a loss of 16.5 NQ points
Cumulative P/L to date:
-50.0 NQ points (over 5 trades)
Folliage: I noticed that you did NOT trade the new contract today (June expiry) but instead decided to stay with the March contract. Why was that? Everyone else has switched over to the June contract...
Cumulative P/L to date:
-50.0 NQ points (over 5 trades)
Folliage: I noticed that you did NOT trade the new contract today (June expiry) but instead decided to stay with the March contract. Why was that? Everyone else has switched over to the June contract...
Since I started tracking this system 4 weeks ago on 2/10/2006 I have seen 5 trades signalled complete with likely entries and stops. I have calculated a total loss of 50 NQ points which at $20 per point and 40 contracts traded per trade gives us a total loss of $40,000 so far.
However, the collective2 system shows the profits/losses of the 5 trades as:
-4,400
10,000
-8,616
4,800
-13,200
which comes to a total loss of $11,416.
So we have a massive discrepancy in the results between mine and collective2's.
Now this discrepancy could be a result of:
1. My mistake in my calculations (or understanding).
2. Bugs in Collective2's software.
3. Deliberate manipulation/falsification of the results.
Folliage appears to have disappeared and hasn't answered my posts about 2nd trade which is the clincher. This one in my opinion should have hit the stop loss and not have been carried over a weekend to a profit on the Monday.
Now granted, Folliage's system might be a very good one and it is just unlucky that I have started testing it at the beginning of a losing streak and all systems have losing streaks. However, it looks like there are serious errors in the reporting and calculating of the results (as I have shown here) and the previous results of this system should not be trusted until Folliage comes forward and gives us a reasonable explanation about what has happened.
I will happily apologize if I have made a mistake in my calculations or my understanding on how the trades should have been taken but so far I have double checked the signals and my calculations and cannot find any mistakes - but I'm not infallible and do make mistakes.
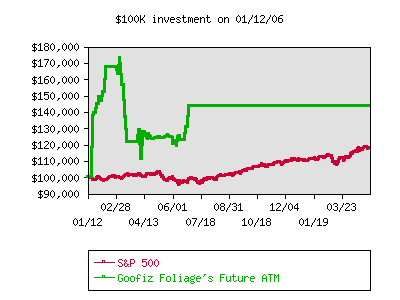
My last comment on this trading system was made on 04/05/2006 and the last trade that was opened/closed on the system was 06/23/2006 - about 10 weeks later. The system lost more money after my last post but subsequently recovered some. There does not appear to be a reason given for the system no longer being active.
Here is the equity curve of the system.
Here is the equity curve of the system.
Click image for original size
Emini Day Trading /
Daily Notes /
Forecast /
Economic Events /
Search /
Terms and Conditions /
Disclaimer /
Books /
Online Books /
Site Map /
Contact /
Privacy Policy /
Links /
About /
Day Trading Forum /
Investment Calculators /
Pivot Point Calculator /
Market Profile Generator /
Fibonacci Calculator /
Mailing List /
Advertise Here /
Articles /
Financial Terms /
Brokers /
Software /
Holidays /
Stock Split Calendar /
Mortgage Calculator /
Donate
Copyright © 2004-2023, MyPivots. All rights reserved.
Copyright © 2004-2023, MyPivots. All rights reserved.