ES Monday 9-16-13
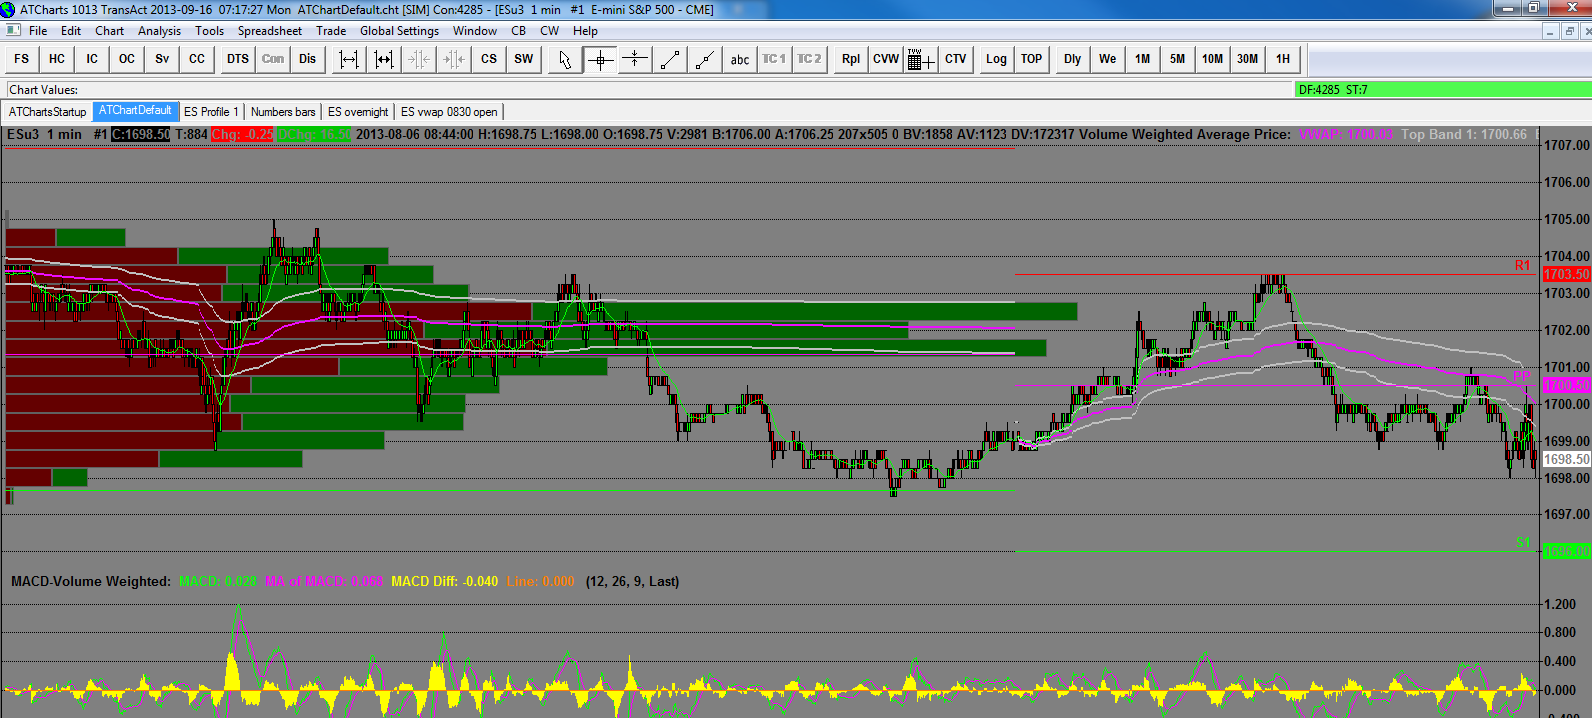
Big gap up over the weekend, back into record territory. The first chart is from August 5th and 6th, the last time we were at these levels. I didn't snap lines but you can see the high at 1705, the dip down to about 1697.50 and the retrace to 1703.50. After that the market started to fall off.
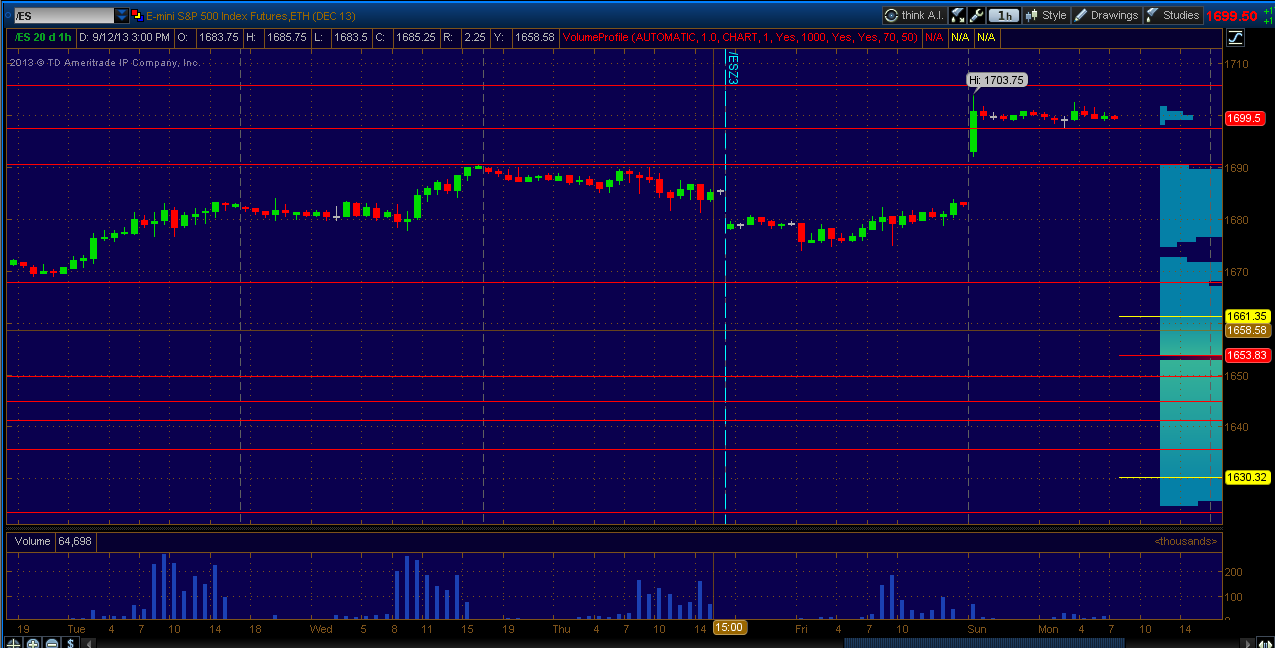
The second chart is current 60 minute. The lines only depict last weeks highs and the overnight support level which is also at 1697.50. Overnight markets are balanced and it's a long way back to fill the gap. Fed meetings this week to contend with also.
Click image for original size
The second chart is current 60 minute. The lines only depict last weeks highs and the overnight support level which is also at 1697.50. Overnight markets are balanced and it's a long way back to fill the gap. Fed meetings this week to contend with also.
Click image for original size
most times it certainly seems as if they know about the bracket test concept.....so we get tortured...luckily we play small and like bkay said...this time of day can have lots of noise
Not liking it, coming off at 96.50, I'll stand aside and let your short run Bruce
30 minute vpoc's have all the volume on last two bars right near 97 and 97.25......putting stop on my measly runner at entry of 97.50....only volume node below is down near 93.75....not a lot of confidence and the noise will probably shake this one out
nice bracket test but doesn't mean that much since we are balancing inside the IB
Saved myself a point. Time for a break
matching lows at 93.75 too...will target 94.25......this was a zone from the oevrnigh so will try to get out in front...If I had additional contracts working I'd be tryingto take off as we move down......"ya can't do much if ya don't got the goods"
in my wishful thinking world we have that double low at "d and e "period and a selling tail inside the Ib range in "G" period....
I started my profile with letter "b"
I started my profile with letter "b"
here's a video of what I was trying to expalin
Hi Bruce, how do you get that handy dandy chart? I use Ninji.... not sure what kind of chart that is...... you break up the volume profiles into 30min segment historgrams?
just pulled the plug when they were printing 94.50....not into torture when I'm only holding only one contract left
OK, I did figure out how to set up that 30min volume profile chart.... So what Is the best way to use this?
I understand it is showing me where the most volume is at certain prices. It is my understanding from watching you that ...these levels are then areas to be aware of for support and resistance areas?
thanks if you can lead me to some of your videos that explains this more.
I understand it is showing me where the most volume is at certain prices. It is my understanding from watching you that ...these levels are then areas to be aware of for support and resistance areas?
thanks if you can lead me to some of your videos that explains this more.
Emini Day Trading /
Daily Notes /
Forecast /
Economic Events /
Search /
Terms and Conditions /
Disclaimer /
Books /
Online Books /
Site Map /
Contact /
Privacy Policy /
Links /
About /
Day Trading Forum /
Investment Calculators /
Pivot Point Calculator /
Market Profile Generator /
Fibonacci Calculator /
Mailing List /
Advertise Here /
Articles /
Financial Terms /
Brokers /
Software /
Holidays /
Stock Split Calendar /
Mortgage Calculator /
Donate
Copyright © 2004-2023, MyPivots. All rights reserved.
Copyright © 2004-2023, MyPivots. All rights reserved.