ES Monday 9-16-13
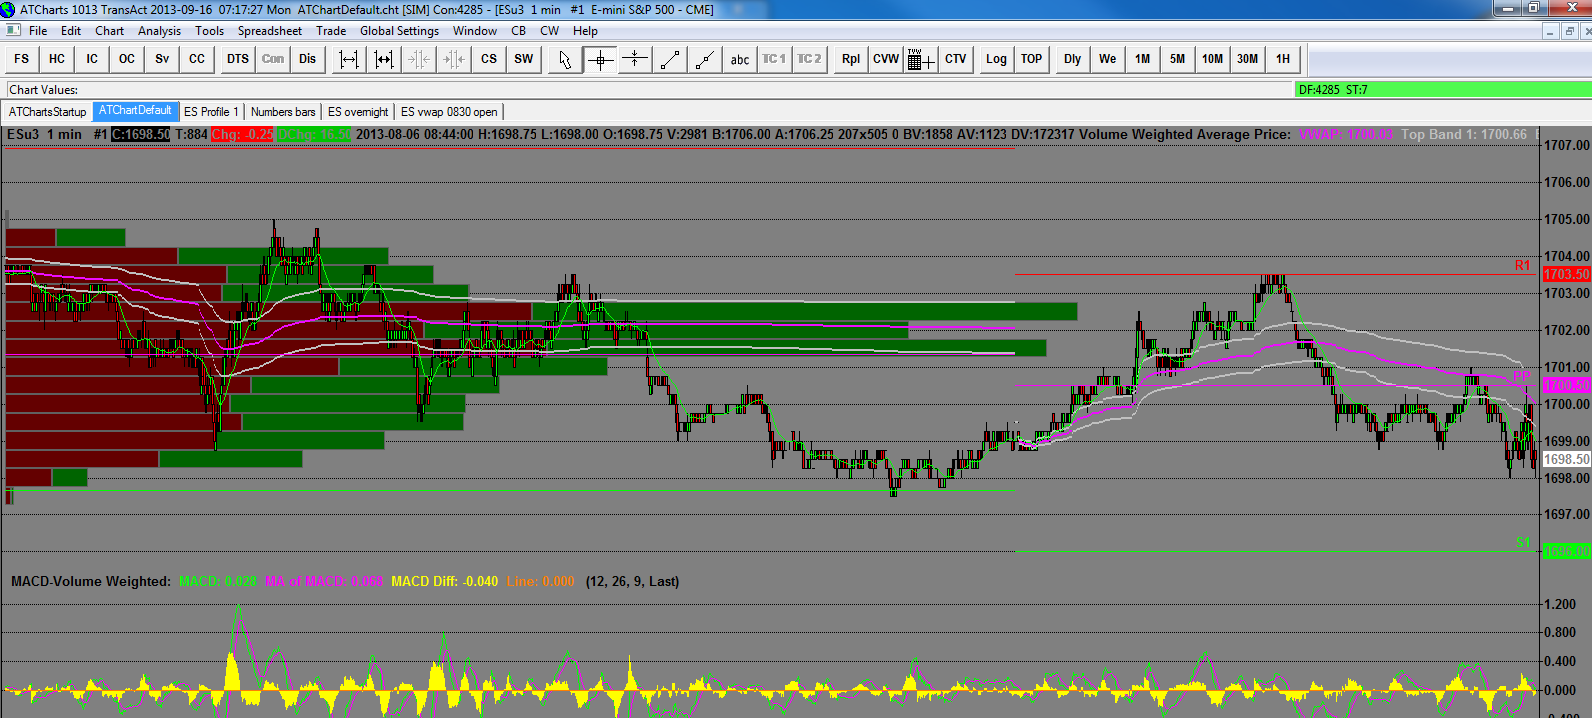
Big gap up over the weekend, back into record territory. The first chart is from August 5th and 6th, the last time we were at these levels. I didn't snap lines but you can see the high at 1705, the dip down to about 1697.50 and the retrace to 1703.50. After that the market started to fall off.
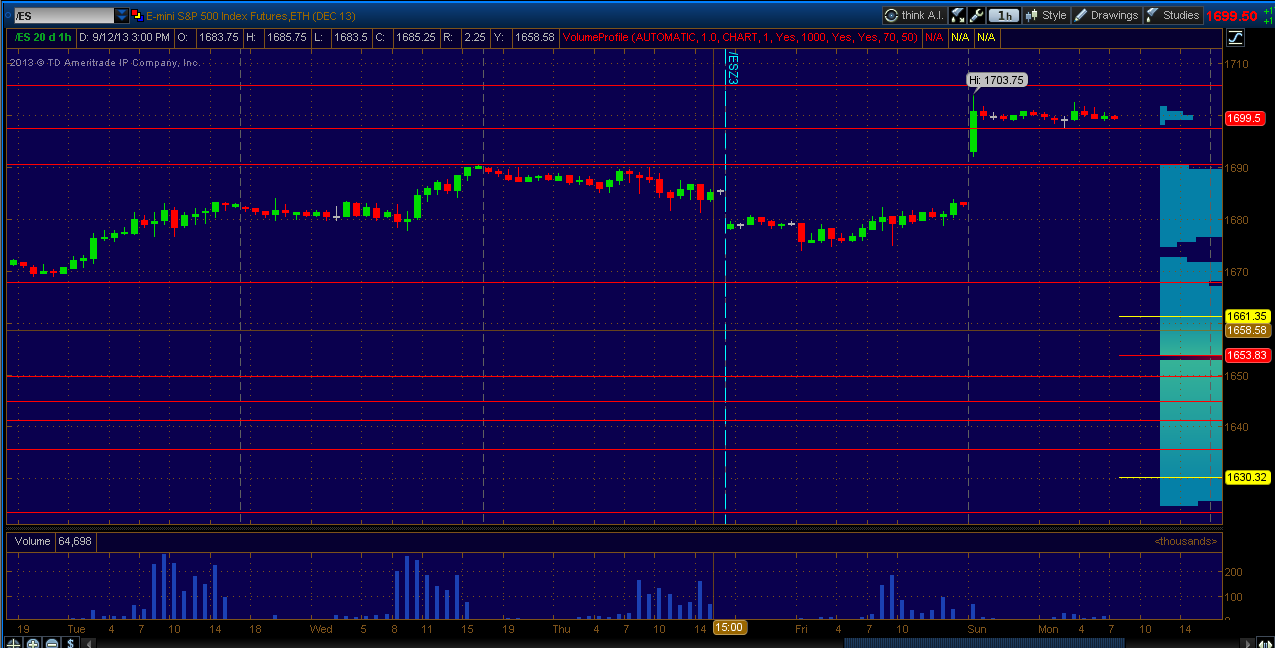
The second chart is current 60 minute. The lines only depict last weeks highs and the overnight support level which is also at 1697.50. Overnight markets are balanced and it's a long way back to fill the gap. Fed meetings this week to contend with also.
Click image for original size
The second chart is current 60 minute. The lines only depict last weeks highs and the overnight support level which is also at 1697.50. Overnight markets are balanced and it's a long way back to fill the gap. Fed meetings this week to contend with also.
Click image for original size
that is correct.....you can do it with any time period but the 30 minute goes well with the market profile 30 minute bars....it's just simply a mini volume histogram on each 30 minute bar........I use market delta....I'm sure Ninja could do it somehow
Originally posted by daddywolf
Hi Bruce, how do you get that handy dandy chart? I use Ninji.... not sure what kind of chart that is...... you break up the volume profiles into 30min segment historgrams?
this is three lower lows now......so we know they like to push for 90 - 120 minutes....aggressive traders will be taking longs as we poke near that 93.75 and into todays buying tail
Originally posted by BruceMNice trade Bruce, just came back, Looks like I was all kinds a wrong on that one
just pulled the plug when they were printing 94.50....not into torture when I'm only holding only one contract left
this 90 area would be the spot for me.........whew...so glad I wasn't an aggressive trader
no big deal bkay...If I hadn't just exited a tarde I may have been trying to buy that break of 93.75...I like this area down here now but all we expect is the IB test
91.50 is the line to beat otherwise we keep selling off....
I agree with you there, and I have nothing between 90.25 and the gap fill
Another tech glitch keeping options players out of the market
I'm like to see them try to get back and test that 93.50..just under that evil 93.75
I have the 86 - 87.50 under here...probably better then that the 85 - 87 zone I posted this a.m....
I'd change target to 93.25 to be safe.....
I'd change target to 93.25 to be safe.....
OK, I did figure out how to set up that 30min volume profile chart.... So what Is the best way to use this?
I understand it is showing me where the most volume is at certain prices. It is my understanding from watching you that ...these levels are then areas to be aware of for support and resistance areas?
thanks if you can lead me to some of your videos that explains this more.
I understand it is showing me where the most volume is at certain prices. It is my understanding from watching you that ...these levels are then areas to be aware of for support and resistance areas?
thanks if you can lead me to some of your videos that explains this more.
Emini Day Trading /
Daily Notes /
Forecast /
Economic Events /
Search /
Terms and Conditions /
Disclaimer /
Books /
Online Books /
Site Map /
Contact /
Privacy Policy /
Links /
About /
Day Trading Forum /
Investment Calculators /
Pivot Point Calculator /
Market Profile Generator /
Fibonacci Calculator /
Mailing List /
Advertise Here /
Articles /
Financial Terms /
Brokers /
Software /
Holidays /
Stock Split Calendar /
Mortgage Calculator /
Donate
Copyright © 2004-2023, MyPivots. All rights reserved.
Copyright © 2004-2023, MyPivots. All rights reserved.