ES Tuesday 10-15-13
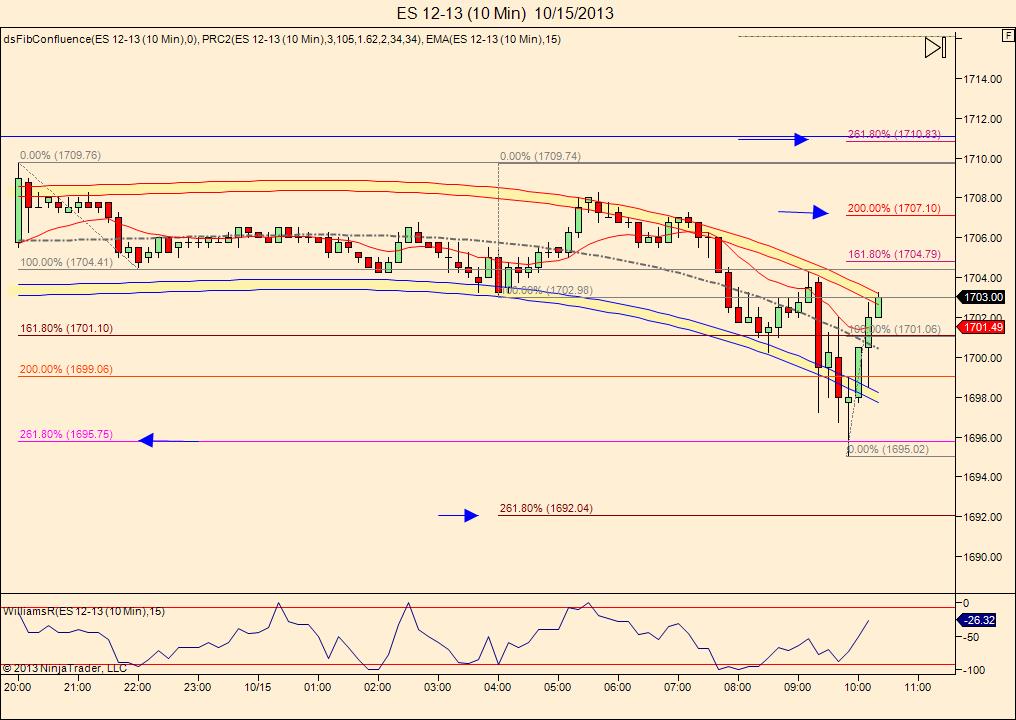
1704.50 is magnet price for me today
1699 - 1700.50 first zone
then 96.50
key LVN at 92- 93.50
above is 1707.50 and 1710
1699 - 1700.50 first zone
then 96.50
key LVN at 92- 93.50
above is 1707.50 and 1710
great job,Bruce
Originally posted by BruceM
... overnight midpoint...
Bruce, when you refer to overnight midpoint, do you mean the 24-Hour mid-point (which continues into RTH) or 24-Hour mid-point as of RTH Open?
...heres my prices for the early going..you can see why i bought 1695.75
Click image for original size
this goes well with Nicks post and sums up where the BEST trades come from IMHO...so you'll have to excuse this RAMBLE
JUST THE MIDPOINT OF THE DATA THAT HAPPENED WHILE i AM AWAY FROM THE MARKET....SO FROM 4:15 P.M. EASTERN TIME UNTIL 9:30 a.M - THAT IS THE OVERNIGHT TO ME
SORRY FOR SHOUTING AND THE CAP LOCKS
SORRY FOR SHOUTING AND THE CAP LOCKS
this is all happening on low vertical volume so I am suspicious Rburns but for the most part I don't give it too much thought as a short term trader......I really mostly just define my areas and trade them when price gets to them.......I do keep in mind some probabilities but those usually don't keep me out of a trade or allow me to hold for bigger moves
for example , we only have inside days 15 % of the time but even so I am not trying to hold anything for the break of yesterdays RTH highs...I prefer to take smaller pieces and get out when I can....often perhaps trying to hold for a bigger move but rarely get those..we also go back to the POC or vpoc quite often but I am satisfied leaving that to others quite often too.....there is a big comfort being OUT of the market and being satisfied.......it can be frustrating to miss big moves but it can also be frustrating to try and hold for them
sorry to go off here...I just trade the levels..sorry I can't be more help
a special shout out to Nick who has been helping me organize chart layouts and getting me some help with displaying data more clearly......so a big THANKS !!!
Thx Bruce great explanation on those bell curves....
np bruce...just a small token of appreciation for all you do here
Originally posted by BruceM
a special shout out to Nick who has been helping me organize chart layouts and getting me some help with displaying data more clearly......so a big THANKS !!!
yesterday we broke through fridays highs at 99.50......so we always need to keep those and formulate that into our key areas...they want to know if that breakout is real to keep the uptrend in tack.......just like single prints on the 30 minute...same concept but with daily bars...nuff said
bruce, i have 706.25 as poc for 9/20, so it closed today on that touch of 706.5...i had 706-707 as a zone as shown on that chart i posted early this morning, to account for yest rth high, that poc and a little edge from 9/20 at 07
hope it helps
hope it helps
Originally posted by BruceM
I'm looking for someone with tic data to verify a zone I'm babbling about on this video......and I fess up to a mistake I made which cost me an opportunity today
Emini Day Trading /
Daily Notes /
Forecast /
Economic Events /
Search /
Terms and Conditions /
Disclaimer /
Books /
Online Books /
Site Map /
Contact /
Privacy Policy /
Links /
About /
Day Trading Forum /
Investment Calculators /
Pivot Point Calculator /
Market Profile Generator /
Fibonacci Calculator /
Mailing List /
Advertise Here /
Articles /
Financial Terms /
Brokers /
Software /
Holidays /
Stock Split Calendar /
Mortgage Calculator /
Donate
Copyright © 2004-2023, MyPivots. All rights reserved.
Copyright © 2004-2023, MyPivots. All rights reserved.