ES Tuesday 11-5-13
levels I am watching.....that 58 - 59 is still the dividing line between the buyers who want last weeks highs and the sellers who want to get the lows
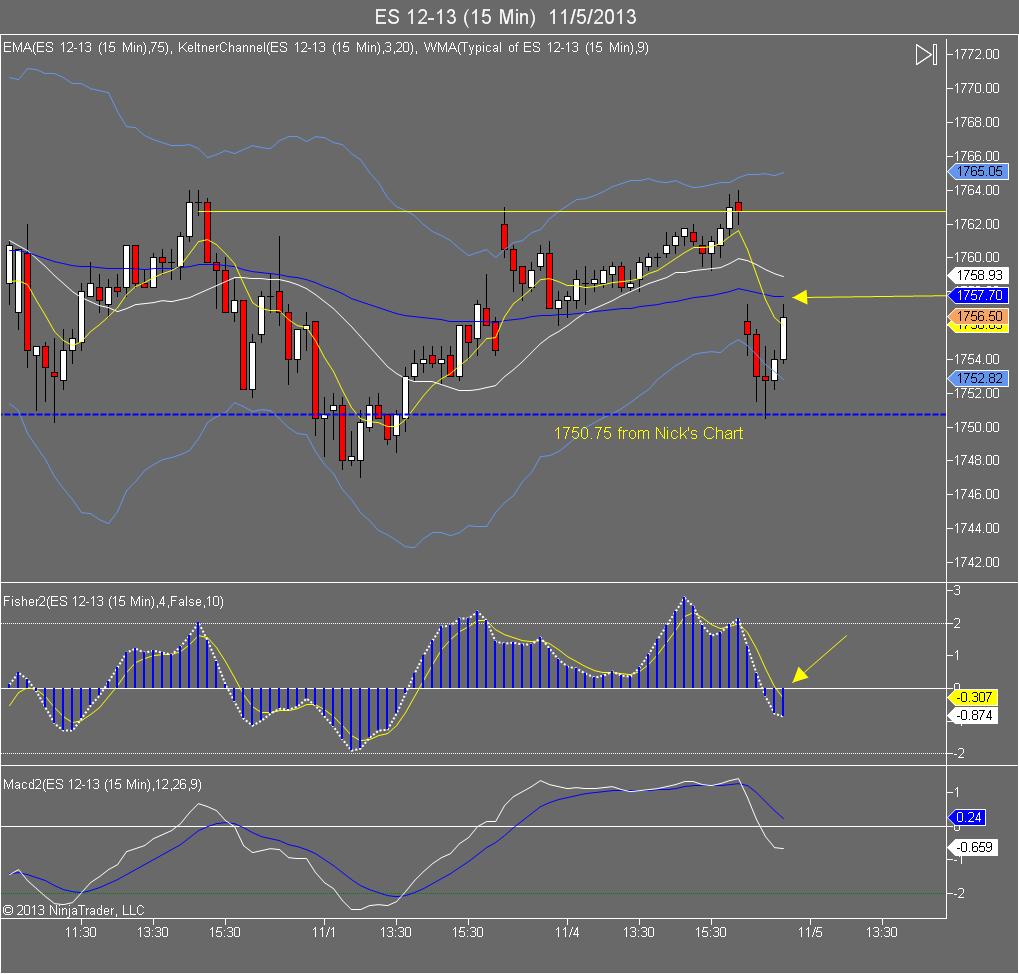
Counter Trend bounce back to blue line on the 15 minute, looking to get short.... Note 15 minute fisher below zero and declining...
Click image for original size
Originally posted by BruceM
one question here....ok maybe more than one....what would keep you off the long at about 9:40 or so...you had a divergence and the signal line crossed........this is also the 24 hour chart so perhaps the RTH didn't show that.........an overall question is : do u have filters that would keep u off the signals ..or do u just take them as they come?Originally posted by pt_emini
The simple answer is I was making the video when the first divergence formed... lol ... j/k
I take the signals off the 2 minute chart within the context of the larger picture, your and Nick's key price levels for example. Or as in the video I posted, both the 15 and 60 minute charts were indicating (to me) a down bias at the open. If I had taken that first divergence signal on the 2 minute chart, then I would have taken some off at the blue line and subsequently been stopped on any remaining contracts when the blue line held.
For a counter-trend 'fade' entry, as in this case long, I prefer signals that form well away from the blue line, the further away the better. Also, I use the MACD to filter all of my trade signals. The stronger the trend the more filtering I like to do. So in a really strong trend I need to see both the fisher cross zero and the MACD cross it's signal line to consider a counter-trend entry.
My basic approach is to take trades in the direction of the larger time frames. What that means is in a trend I am fading the faders. But when we come into a key price level, I will take a quality divergence signal with MACD confirmation. I am not particularly worried about missing the exact turning point, I am happy to join the new trend late. (I prefer to get in later, rather than being run over early). Often I will completely miss the ideal divergence entry , and take the first counter-trend entry (first C-Point) that forms in the new trend direction (as indicated by MACD). (= VO's 1-2-3 entry setup).
watching 59.75 - 61 for a short signal...keeping it small...target would be back to 57.75
59.75 is single prints from On and also yesterdays POC..the challenge with this is that YD VA was so small they could just as easily blow through it to the other side...aND THAT PUSHES TO THE DAILY PIVOT AND va HIGH AT 61.25...
SO DON'T GET TOO COCKY AND WATCH THAT 57.50 AREA.....
OOPPS SORRY FOR CAPS
SO DON'T GET TOO COCKY AND WATCH THAT 57.50 AREA.....
OOPPS SORRY FOR CAPS
Originally posted by BruceM
which time frame do u prefer to watch in order to enter ..the 2 minute or 15 minute?
For me the 60, 15, and 5 minute charts are for trade setup / market analysis. To get a feel for the larger context within which the faster chart signals trigger. MP charts obviously serve the same purpose.
For example, one of the trade setups I really like is the reversal candle off the 5 minute keltner channel line. If I can get a 2 minute divergence to go along with that trade setup, even better. We could replace my 5 minute chart keltner band with an MP level of interest, where perhaps the market forms a down gap open , then retraces back to the prior day's value area low. So I would look for a clear 2 minute chart action signal at that price level for an entry.
I have a list of trade setups I look for on these charts, but I start at the analysis time frames (5, 15, 60), then once I have something of interest, I will use the faster 2 minute and for the ES, I also like the 3000 or 5000 volume charts for trade signals. So it's a combination of a longer term setup and a fast chart signal to trigger the trade entry. When everything comes together in good order, then I have a trade. I like to see some confirmation the market has turned before entering, which the 2 minute or 3000 volume fisher signal gives me.
Still Waiting for an Entry Short....
Click image for original size
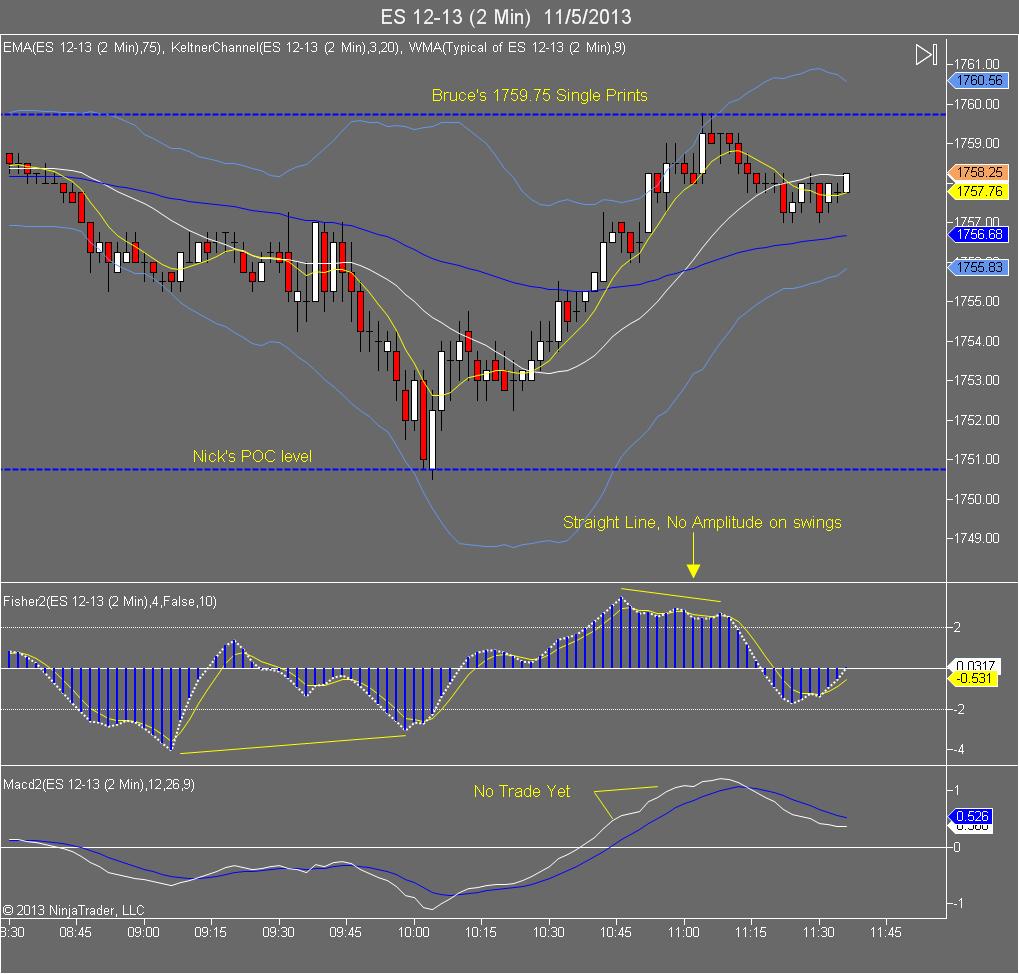
Retesting Bruce's Single Prints, waiting for Short Entry Signal from my Fisher
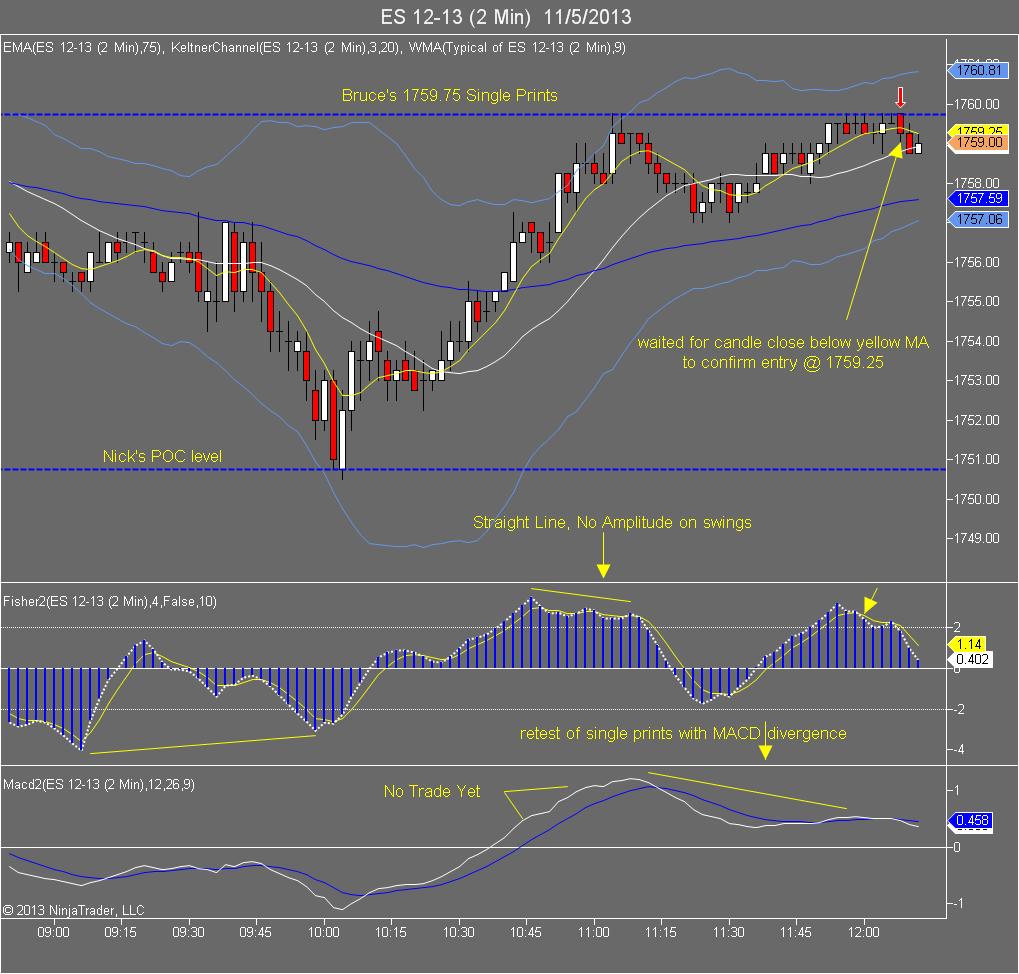
Man i hope you get one otherwise we continue to the next stop around 1761.25.. unfortunately im short from 1757.25 with a 3 point stop. if stopped i will try one more time ....
Click image for original size
Originally posted by rburns
Ho Ho Ho Thanks DT
You're very welcome - how easy was that?
Emini Day Trading /
Daily Notes /
Forecast /
Economic Events /
Search /
Terms and Conditions /
Disclaimer /
Books /
Online Books /
Site Map /
Contact /
Privacy Policy /
Links /
About /
Day Trading Forum /
Investment Calculators /
Pivot Point Calculator /
Market Profile Generator /
Fibonacci Calculator /
Mailing List /
Advertise Here /
Articles /
Financial Terms /
Brokers /
Software /
Holidays /
Stock Split Calendar /
Mortgage Calculator /
Donate
Copyright © 2004-2023, MyPivots. All rights reserved.
Copyright © 2004-2023, MyPivots. All rights reserved.