ES Wednesday 11-6-13
heres how I have it....My market profile chart may have an incorrect volume POC.......so it looks like the single prints I mentioned at 58 go well with the VPOC at 58.25...so a key number if that data is correct...Can someone confirm that VPOC? 68.25 is R2 today..forgot to say that

nice reversal and nice trade kool...same for u bruce...
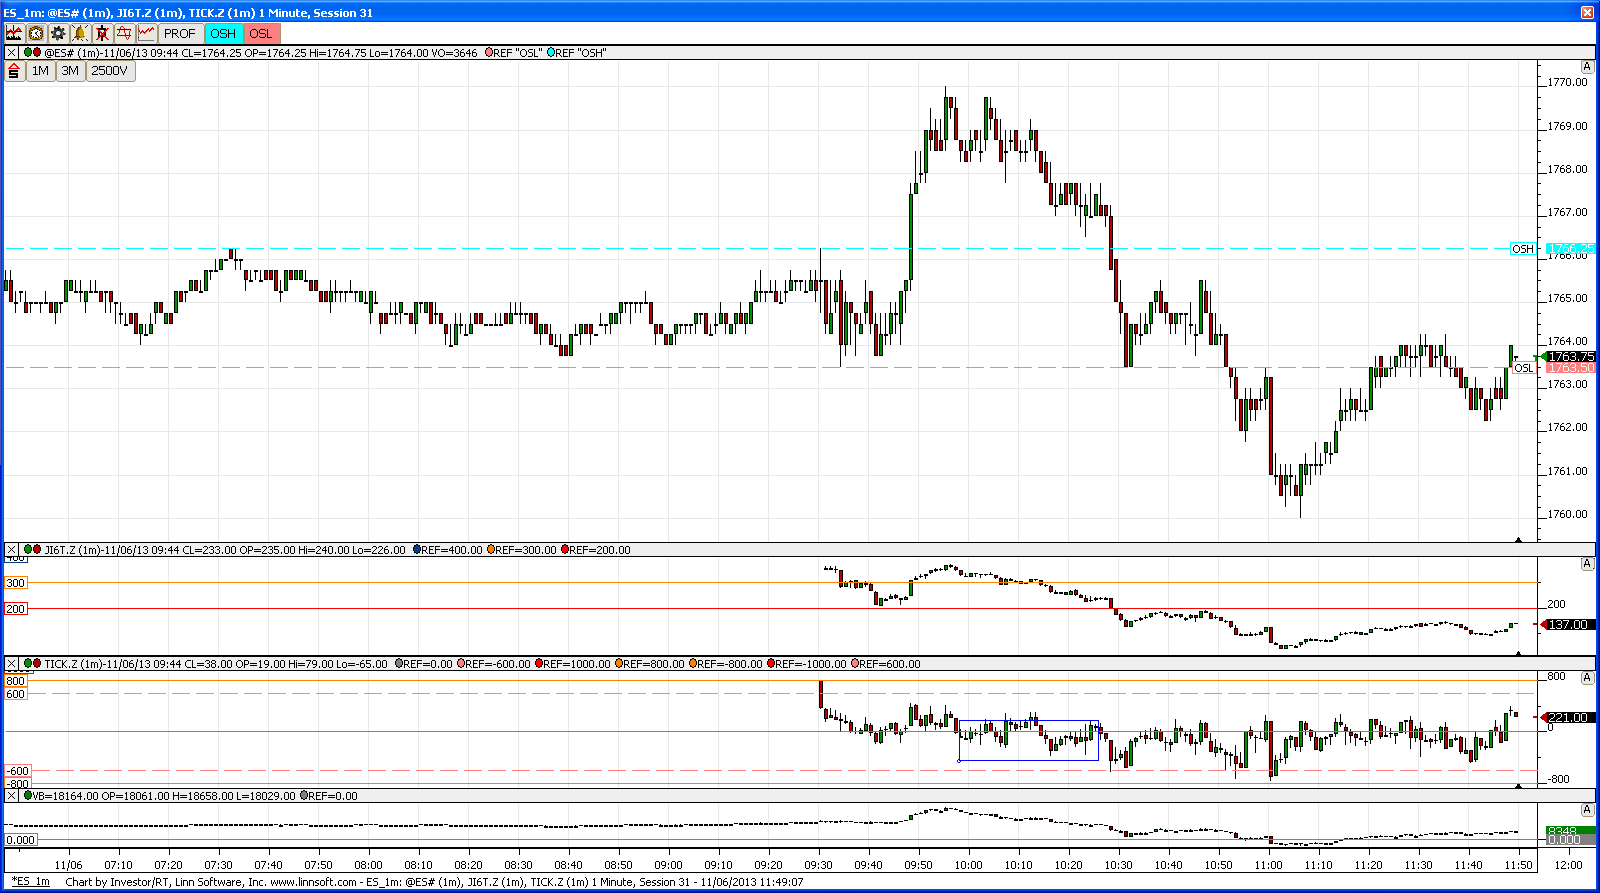
i left after my runners on the long off 62-64 were stopped right below the o/n high and came back to see the market put in a decent reversal...tick was starting to hint that a decent pb was in order (see picture below) but i missed the short down to the 59.5-60 area
i left after my runners on the long off 62-64 were stopped right below the o/n high and came back to see the market put in a decent reversal...tick was starting to hint that a decent pb was in order (see picture below) but i missed the short down to the 59.5-60 area
Click image for original size
In answer to my own question yesterday to Bruce According to Dalton
• Good highs and good lows are single print tails
– At the top, sellers step in to drive value lower
– At the bottom, buyers step in to drive value higher
– 2 single prints or more make good highs or lows
• Poor highs and poor lows are the opposite, little or no tails
– These are areas with “no excess” inventory
– Sometimes the market goes back to those high/lows except
– They can also happen when only retail traders are trading
– When the market gets too far to an extreme, a poor low plus a “finished looking profile (45 t 60 degrees (shown in the figure), may represent a market that:
• Has gotten too short (for a poor low)
• Or too long (for a poor high)
– Poor highs and lows need to be carefully observed and studied to learn how to read them, it is a piece of valuable information
It needs to be read within a larger context to understand and use
r u taking his intensive class Rburns?
Originally posted by rburns
In answer to my own question yesterday to Bruce According to Dalton
• Good highs and good lows are single print tails
– At the top, sellers step in to drive value lower
– At the bottom, buyers step in to drive value higher
– 2 single prints or more make good highs or lows
• Poor highs and poor lows are the opposite, little or no tails
– These are areas with “no excess” inventory
– Sometimes the market goes back to those high/lows except
– They can also happen when only retail traders are trading
– When the market gets too far to an extreme, a poor low plus a “finished looking profile (45 t 60 degrees (shown in the figure), may represent a market that:
• Has gotten too short (for a poor low)
• Or too long (for a poor high)
– Poor highs and lows need to be carefully observed and studied to learn how to read them, it is a piece of valuable information
It needs to be read within a larger context to understand and use
this is still just a traders market...if it wasn't then the R2 level wouldn't have worked, the break from the O/N high would not have returned, we wouldn't have come back to YD range or even hit the r1 level....gap in the data at 65 right now for those who dare
Agree Bruce, ES is stuck on the longer MA's right in the middle of the overall range....
Click image for original size
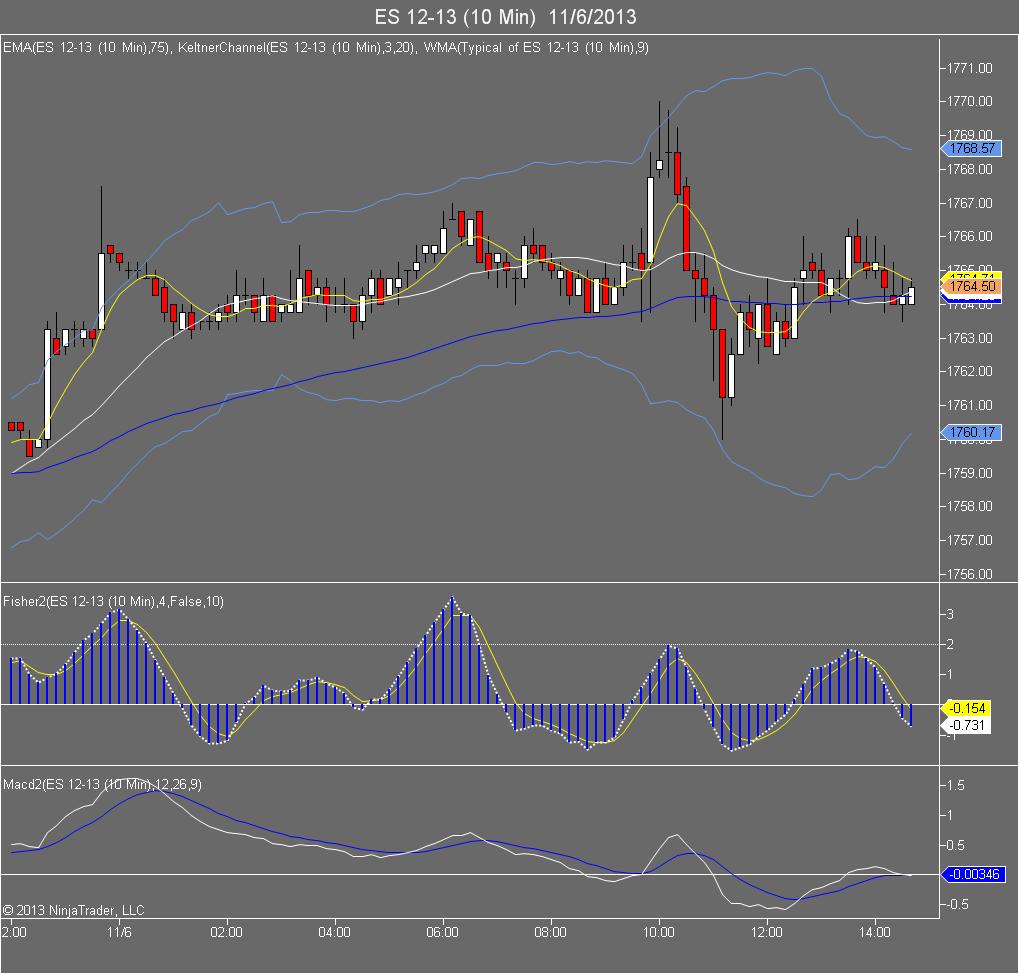
I'm curious to see if we get the "triple bell reversal " close today.....one of the lowest probabilities.
1) we started on lower end of a bell and went to the upside to take out the high end
2) Then we sold off down through the same bell curve on the downside
3) so will they be able to push it up and through a third time today and acheive the low probability high close...
just watching...
1) we started on lower end of a bell and went to the upside to take out the high end
2) Then we sold off down through the same bell curve on the downside
3) so will they be able to push it up and through a third time today and acheive the low probability high close...
just watching...
No Bruce just came across it.
let's see if we can catch a breakout of this narrow range in this last hour of trading
Emini Day Trading /
Daily Notes /
Forecast /
Economic Events /
Search /
Terms and Conditions /
Disclaimer /
Books /
Online Books /
Site Map /
Contact /
Privacy Policy /
Links /
About /
Day Trading Forum /
Investment Calculators /
Pivot Point Calculator /
Market Profile Generator /
Fibonacci Calculator /
Mailing List /
Advertise Here /
Articles /
Financial Terms /
Brokers /
Software /
Holidays /
Stock Split Calendar /
Mortgage Calculator /
Donate
Copyright © 2004-2023, MyPivots. All rights reserved.
Copyright © 2004-2023, MyPivots. All rights reserved.