ES Monday 11-18-13
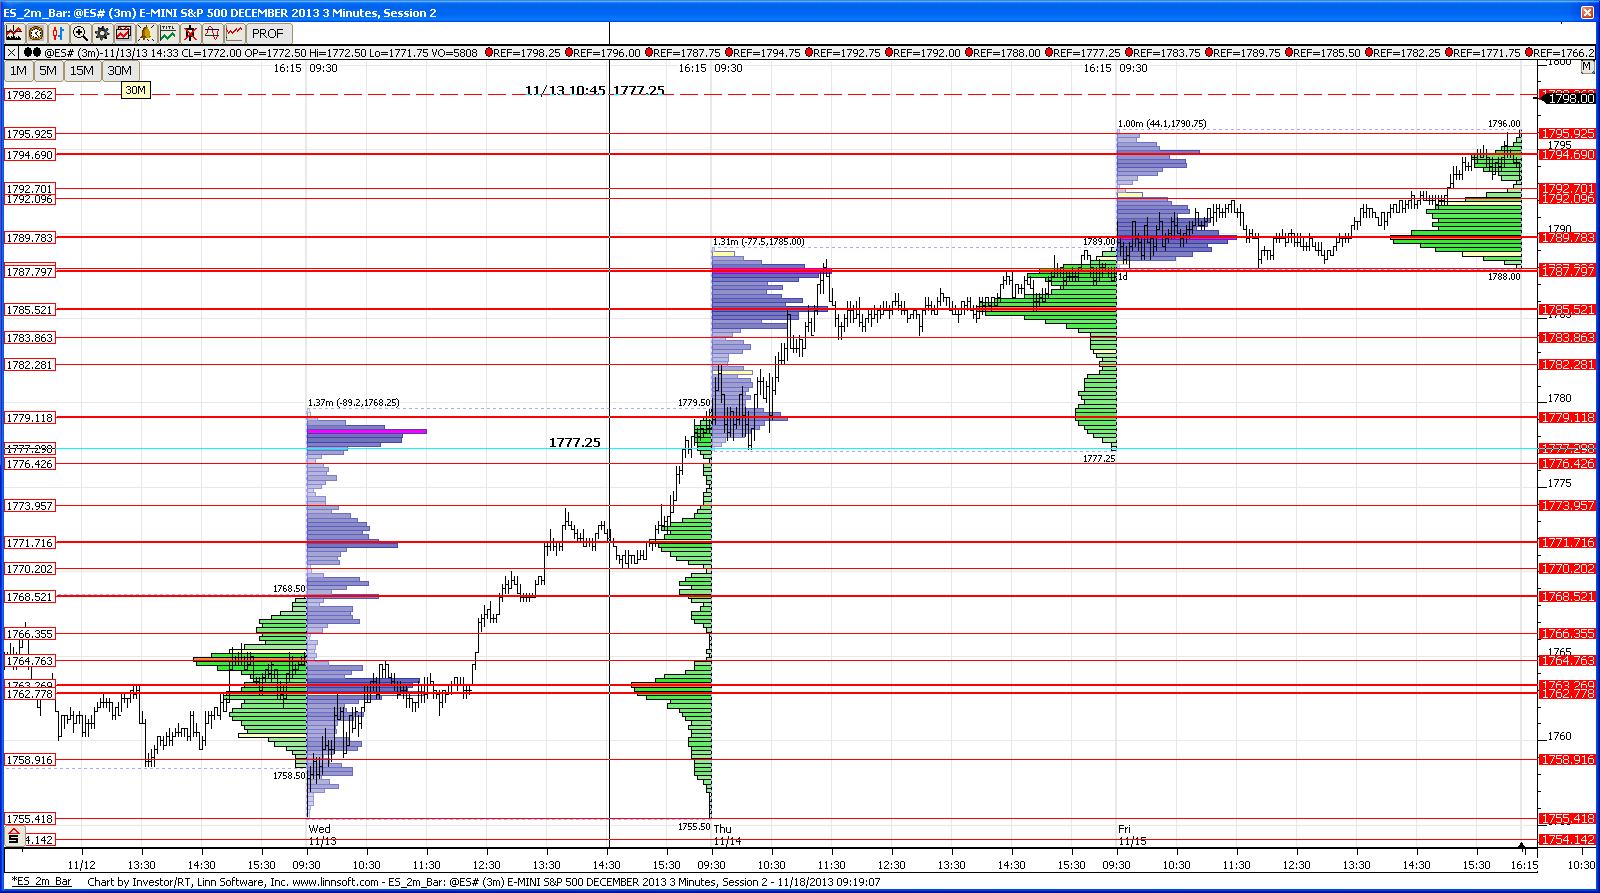
rth chart; only level i adde is the current o/n high at 98.25
pivots worth mentioning above are 1800-1801.5 and then 805 and 807-808 area...808.25 is a measured ab-cd move target as well (754.25-785.25, 777.25-808.25)
good luck today
pivots worth mentioning above are 1800-1801.5 and then 805 and 807-808 area...808.25 is a measured ab-cd move target as well (754.25-785.25, 777.25-808.25)
good luck today
Click image for original size
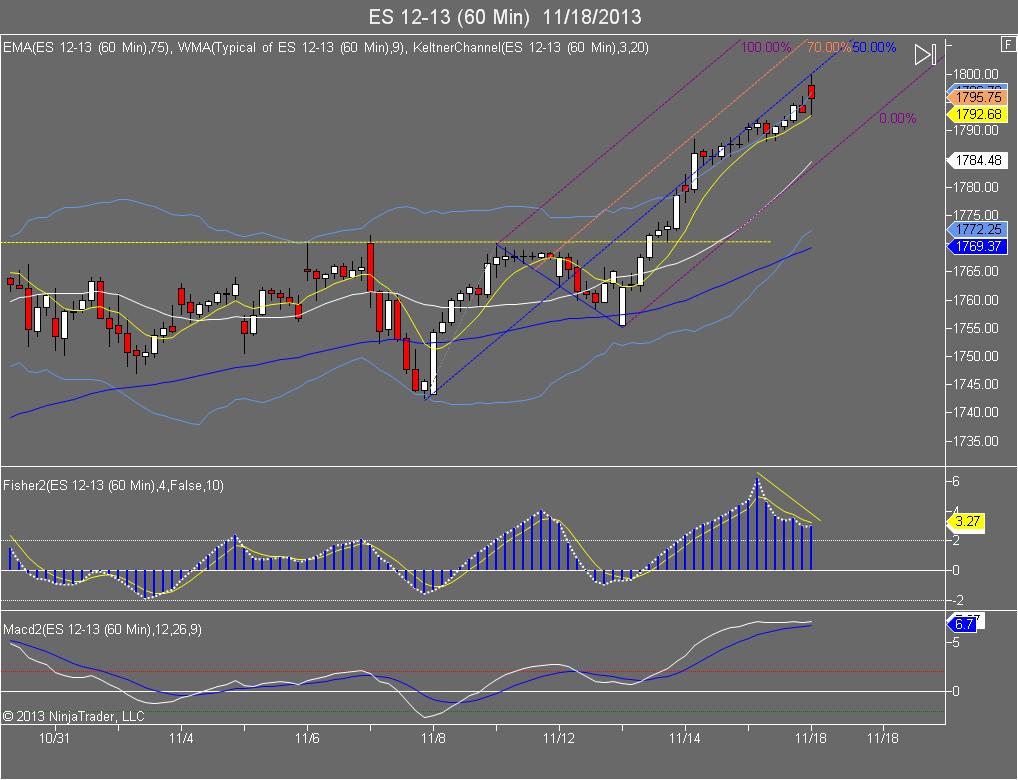
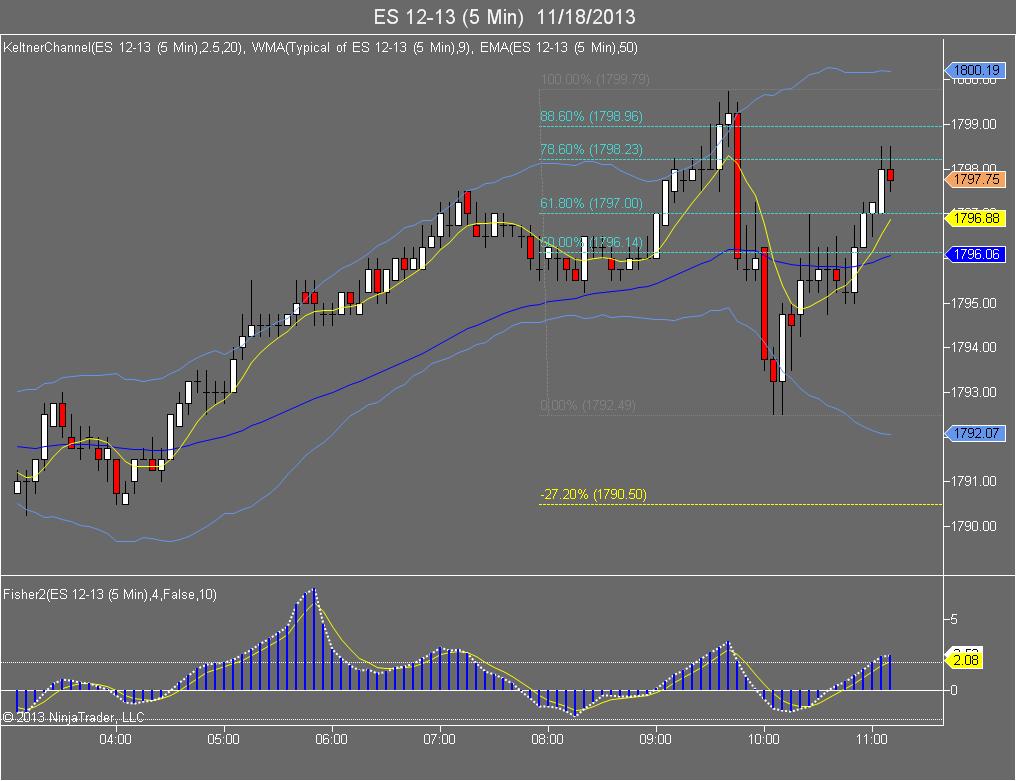
Opening drive up ran into that 50% line on the 60 Minute chart and reversed back down...
Click image for original size
Im thinking they want to test 1800 again
i think so too.
Click image for original size
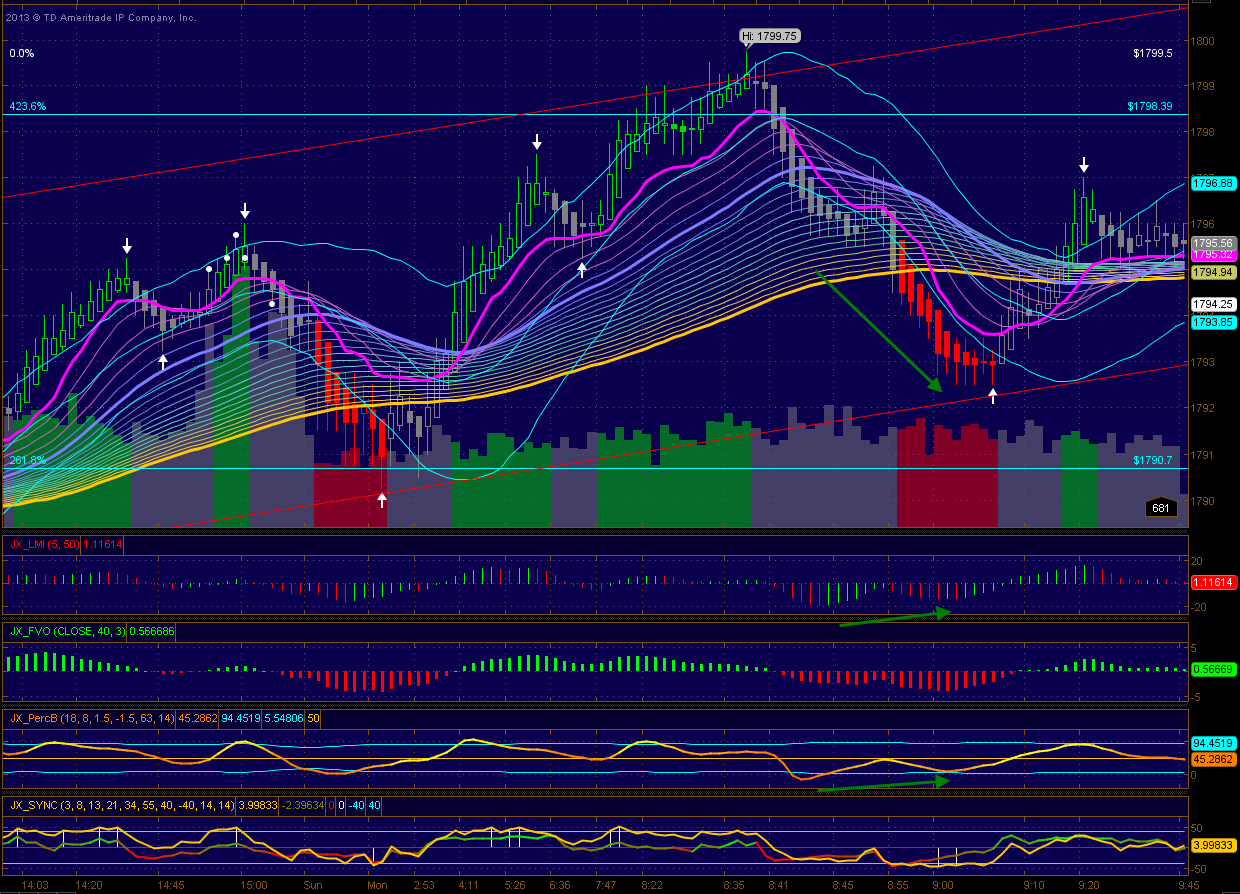
it's moving now and pink line is rising.
Click image for original size
5 Minute chart, Keltner's have contained the morning session...
Click image for original size
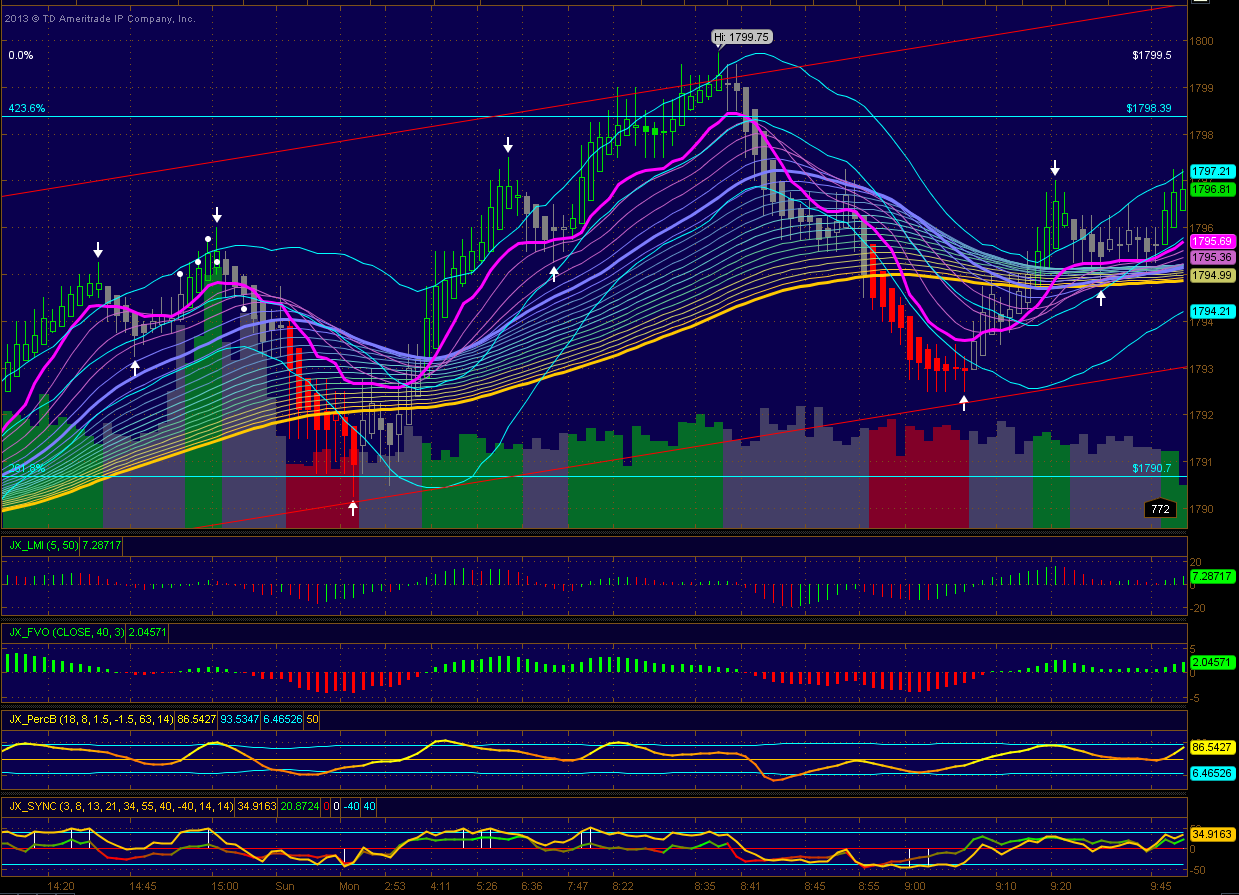
This mornings low hit the first of 5 single prints 1792.75, 1782.50, 1774.25, 1770.25, 1765
94.50 level seems to be holding ... Triangle Breakout higher is my guess from here... maybe go test that 1800 level...
Click image for original size
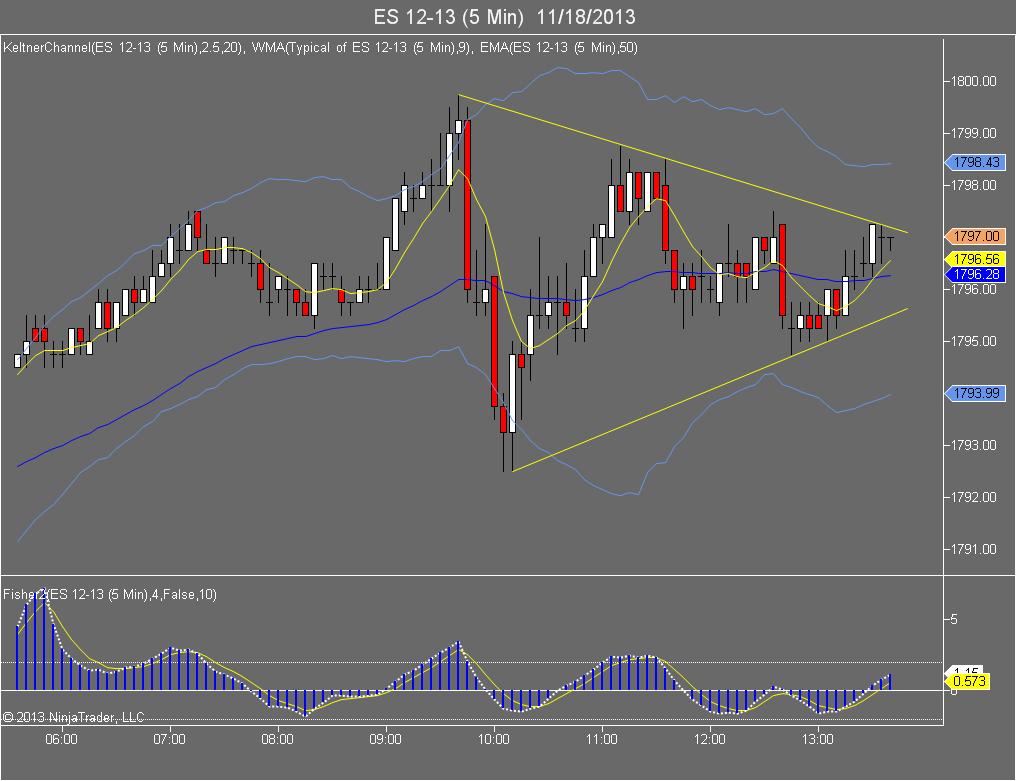
won't a breakout to the upside give a target of ~04 from the triangle?
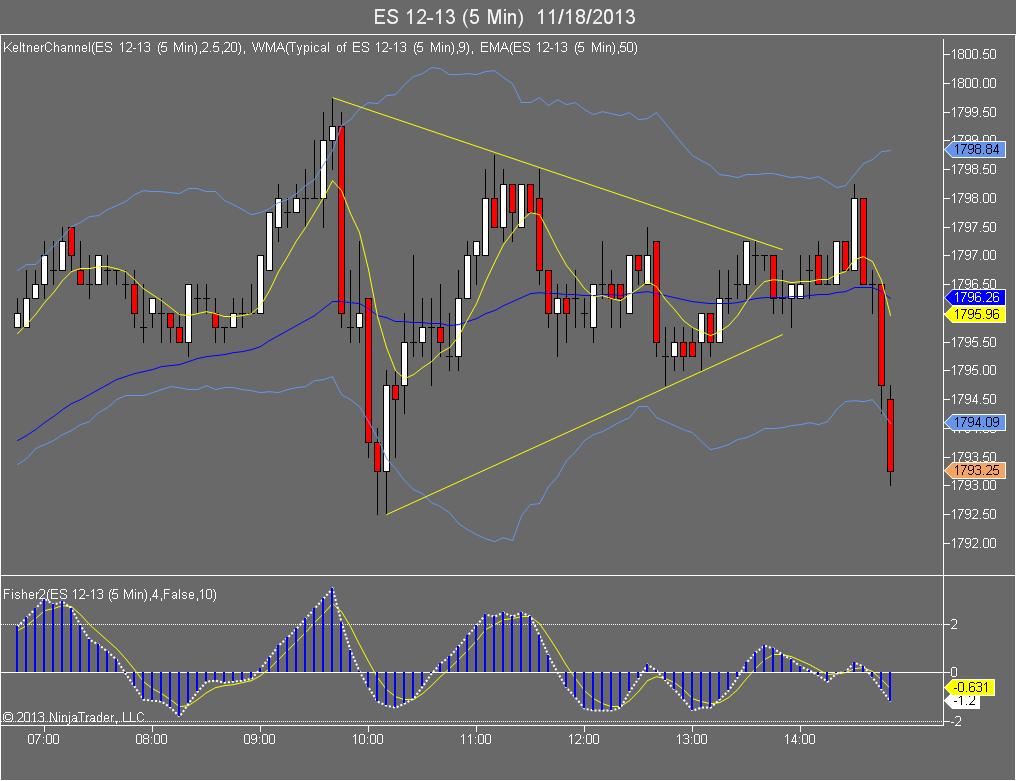
Well that takes care of that triangle...
Click image for original size
Click image for original size
all what i am gonna write is in hindsight so take fwiw, but this is how i saw the day today,...hope it helps though
so today was a tricky day and imo there were only 1-2 clear setups...the short after the open from that 800-801.5 pivot area was a tough one since those areas are not hard resistance areas and stop placement becomes an issue, at least for me...after the rejection 94.5-96 came into, but i would have liked that trade if it had happened right after the open so we could use that 800-801.5 pivot area as a target zone....internals were poor and tick was mixed, so even if u took the long at 96 once we dipped below it (which was also last week's high) it was evident that the next target what the low volume zone/breakout are from friday down at 92-92.75...this also happened to be top of the range during most of the overnight price action...so buyers from friday and the overnight period defende that top of the lower curve from friday and pushed it back to the 96 area which was a natural target for those longs...runners could have aimed for new highs but did not get there as we consolidated in a 94.5-98.5 range for most of the day...the downward break of that range was a bit unexpected but put that 88-89.75 into play...92-92.75 had already been tested so it did not opse too much trouble for sellers and all those that were caught long during day...given the time of the day, the bottom of that 88-89.75 area was a bit more appealing since we also had poor lows from friday parked there...that long did not go well of course...u have to understand that if u r taking 88 u r basically buying the bottom of friday's lower bell curve so by definition that is a lower odds play, but since u could use a 1.5 pt stop and target potentially the ib low, the reward to risk was definitely appealing (2.5:1 reward to risk)....now if u look carefully at the chart i posted this morning and especially at thurs 11/14 u can see a big volume area going from 85.5 up to 88; in fact 85.5 was the poc of time and that was another shot for longs, aiming now first for 88-89.75 area and possibly ib low...the market ended up closing in that area so the whole position could have been unwound there for a 3-3.5 pt profit, at elast making up for the prior loss and some more...a stop below 84 would have been enough for that trade and if that had been taken we would have probably gone down to the 82 area, another decent spot for long (looking for 85.5) if time had permitted
so today was a tricky day and imo there were only 1-2 clear setups...the short after the open from that 800-801.5 pivot area was a tough one since those areas are not hard resistance areas and stop placement becomes an issue, at least for me...after the rejection 94.5-96 came into, but i would have liked that trade if it had happened right after the open so we could use that 800-801.5 pivot area as a target zone....internals were poor and tick was mixed, so even if u took the long at 96 once we dipped below it (which was also last week's high) it was evident that the next target what the low volume zone/breakout are from friday down at 92-92.75...this also happened to be top of the range during most of the overnight price action...so buyers from friday and the overnight period defende that top of the lower curve from friday and pushed it back to the 96 area which was a natural target for those longs...runners could have aimed for new highs but did not get there as we consolidated in a 94.5-98.5 range for most of the day...the downward break of that range was a bit unexpected but put that 88-89.75 into play...92-92.75 had already been tested so it did not opse too much trouble for sellers and all those that were caught long during day...given the time of the day, the bottom of that 88-89.75 area was a bit more appealing since we also had poor lows from friday parked there...that long did not go well of course...u have to understand that if u r taking 88 u r basically buying the bottom of friday's lower bell curve so by definition that is a lower odds play, but since u could use a 1.5 pt stop and target potentially the ib low, the reward to risk was definitely appealing (2.5:1 reward to risk)....now if u look carefully at the chart i posted this morning and especially at thurs 11/14 u can see a big volume area going from 85.5 up to 88; in fact 85.5 was the poc of time and that was another shot for longs, aiming now first for 88-89.75 area and possibly ib low...the market ended up closing in that area so the whole position could have been unwound there for a 3-3.5 pt profit, at elast making up for the prior loss and some more...a stop below 84 would have been enough for that trade and if that had been taken we would have probably gone down to the 82 area, another decent spot for long (looking for 85.5) if time had permitted
Originally posted by NickP
rth chart; only level i adde is the current o/n high at 98.25
pivots worth mentioning above are 1800-1801.5 and then 805 and 807-808 area...808.25 is a measured ab-cd move target as well (754.25-785.25, 777.25-808.25)
good luck today
Click image for original size
Emini Day Trading /
Daily Notes /
Forecast /
Economic Events /
Search /
Terms and Conditions /
Disclaimer /
Books /
Online Books /
Site Map /
Contact /
Privacy Policy /
Links /
About /
Day Trading Forum /
Investment Calculators /
Pivot Point Calculator /
Market Profile Generator /
Fibonacci Calculator /
Mailing List /
Advertise Here /
Articles /
Financial Terms /
Brokers /
Software /
Holidays /
Stock Split Calendar /
Mortgage Calculator /
Donate
Copyright © 2004-2023, MyPivots. All rights reserved.
Copyright © 2004-2023, MyPivots. All rights reserved.