ES Tuesday 12-3-13
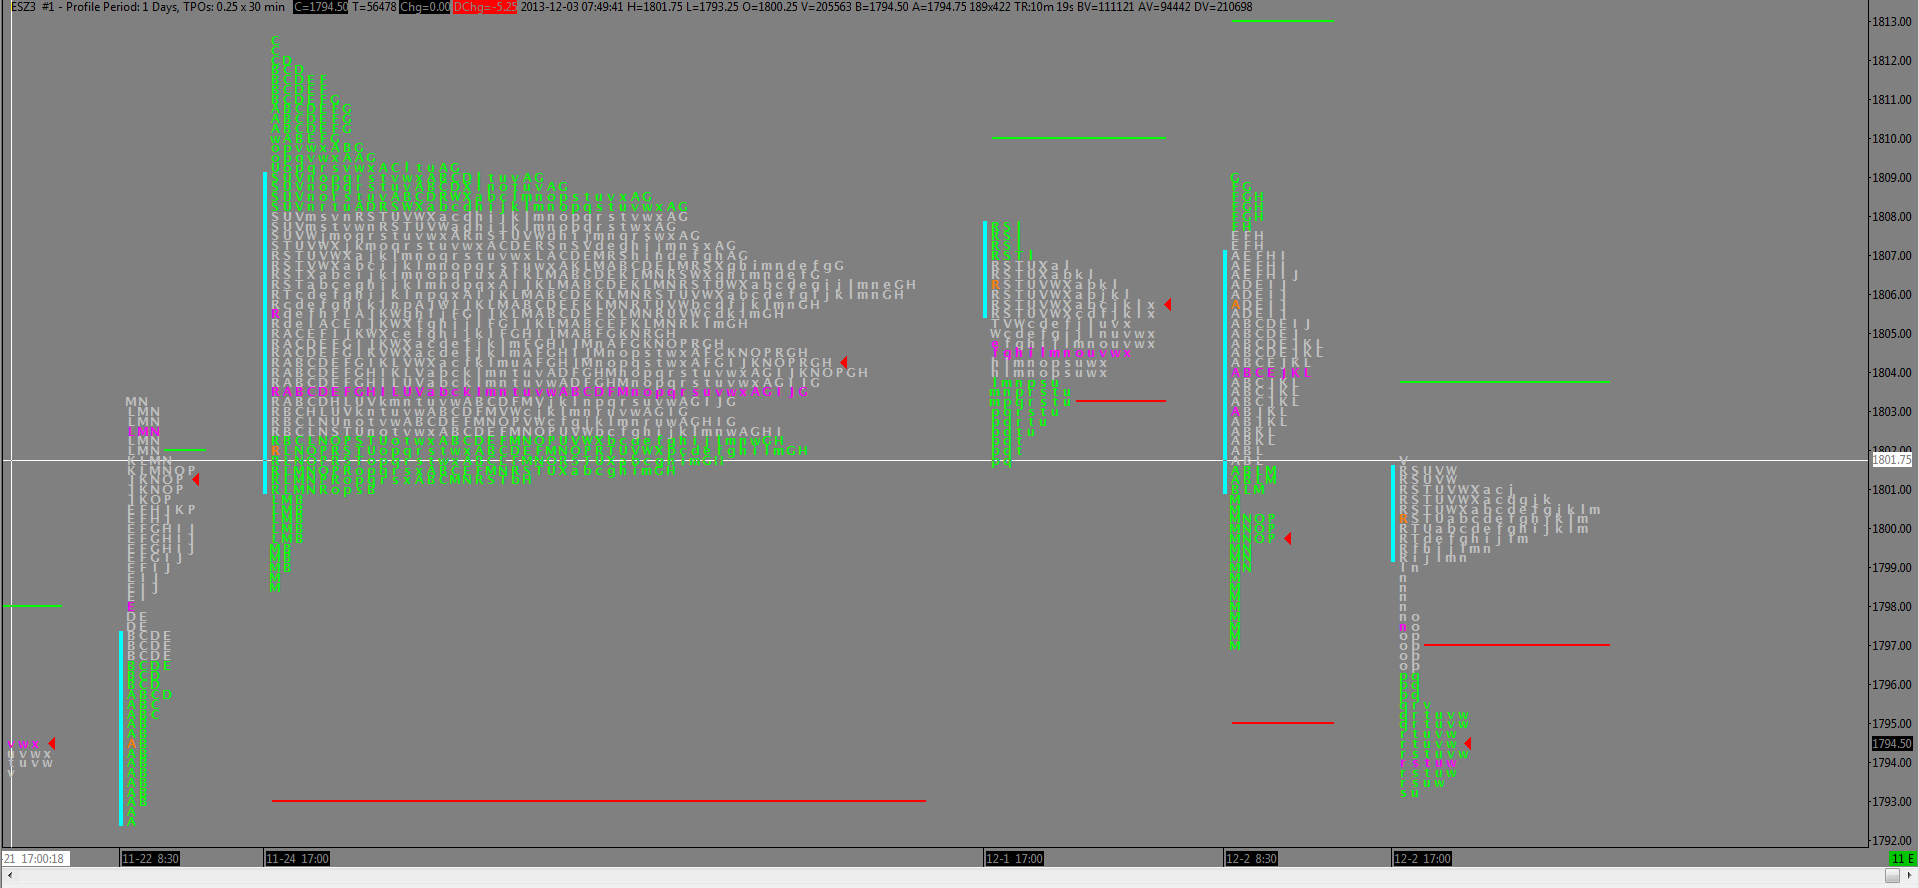
Attached is the same profile from yesterday showing last week as a combined balance area. To the right you have the Sun/Mon overnight and then Monday's session showing balance until late in the session when it sold off below that critical 0100 number. Then we have the current overnight showing continuation below the 0100 area.
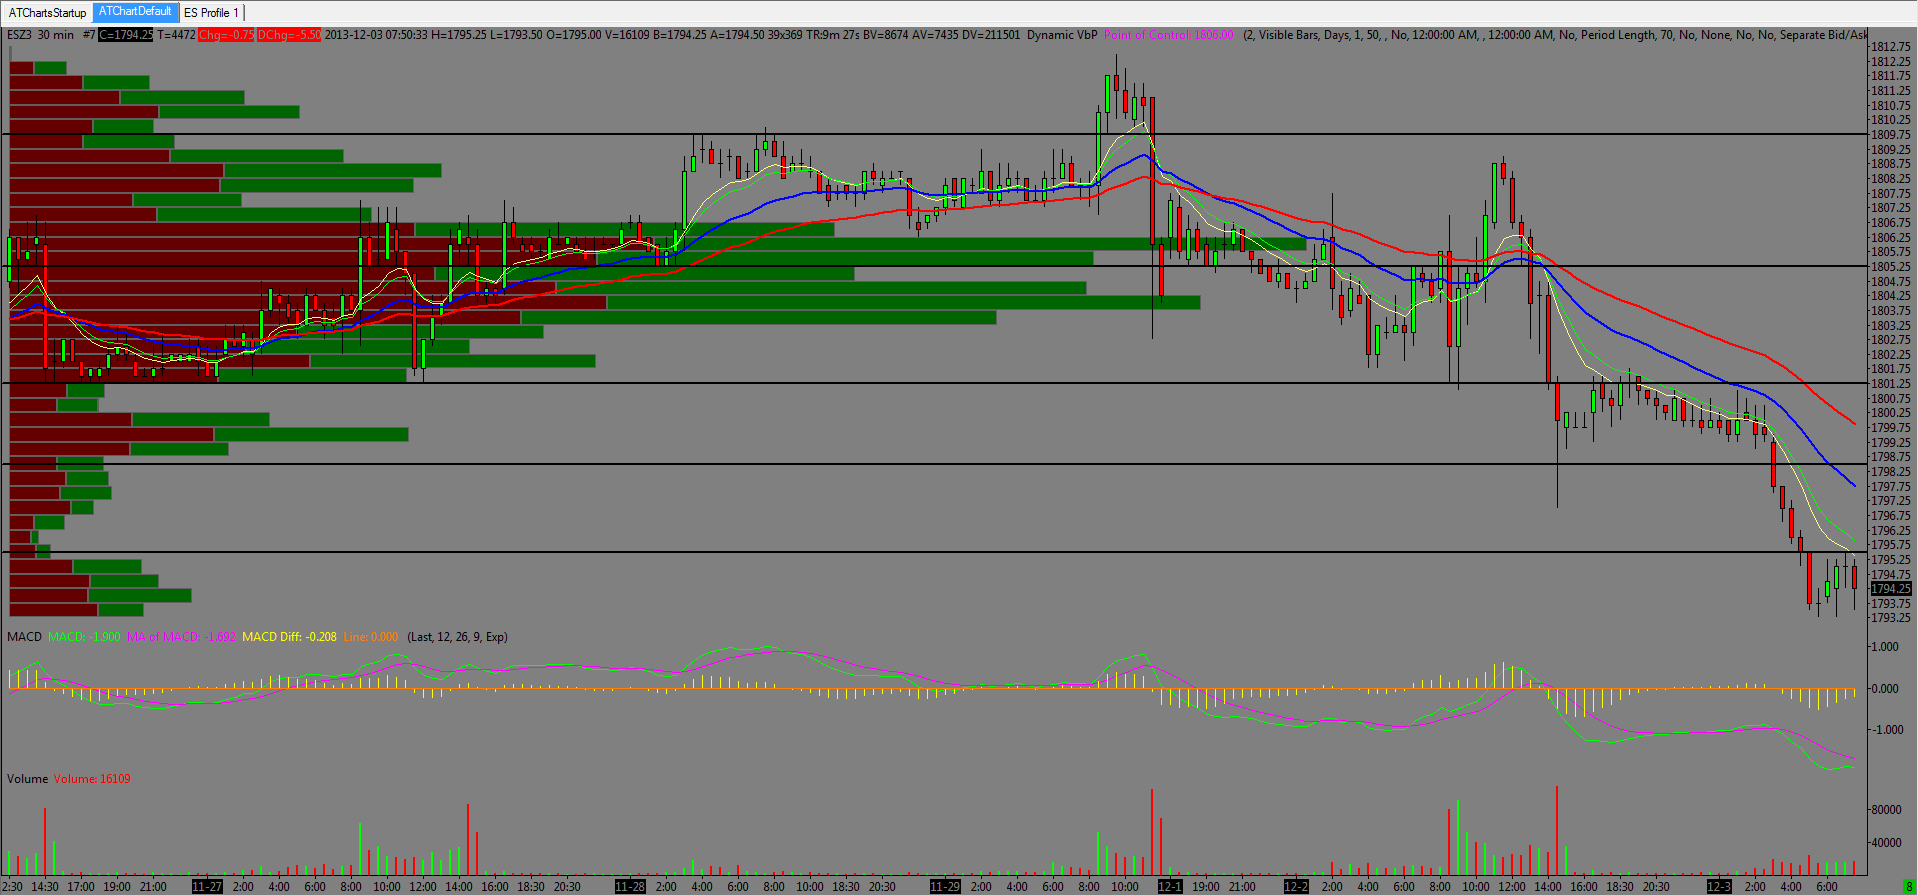
Then we have the current 30 minute which show the breakdown overnight. The lines snapped at 9850 and 9550 were LVMs from earlier in November. We went right thru both and now the 9550 acts as resistance.
Did we get too short overnight? Dunno.
Below this I have the NVPOC at 90.75 and an 8850 LVM. That 92-9250 area was also a key number.
Click image for original size
Thanks pt-I appreciate the input. Sound reasoning also
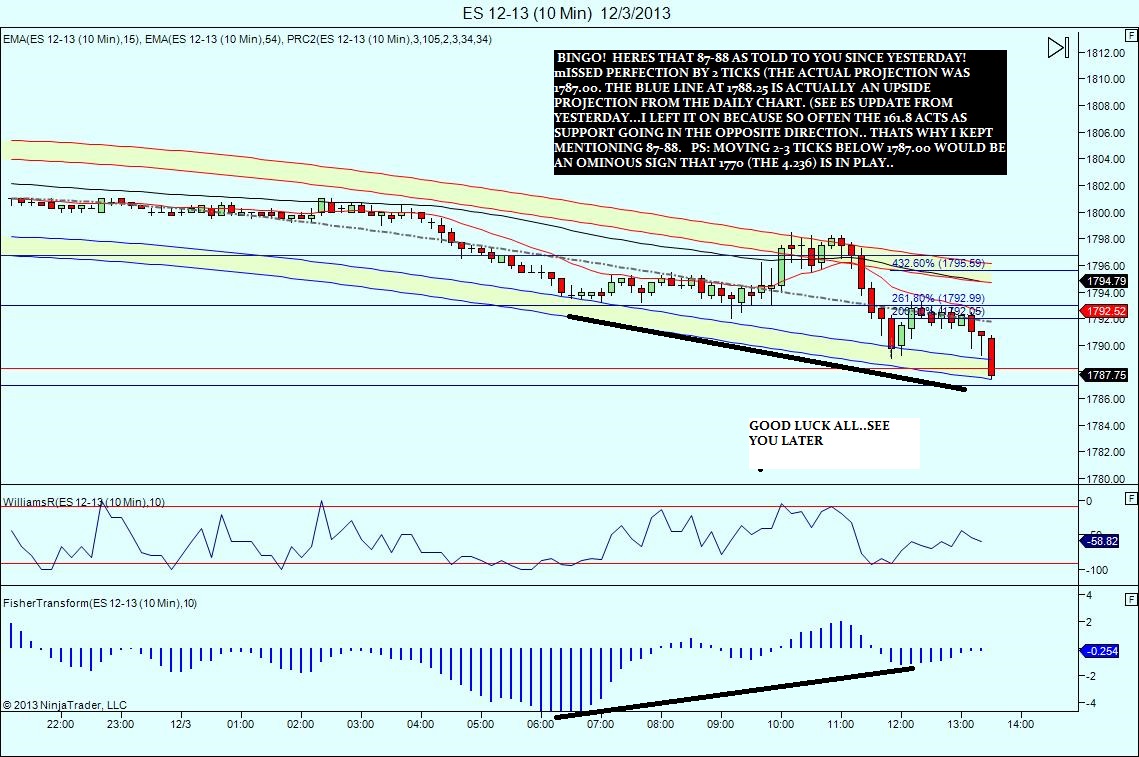
update: not much to say except the one and five min charts have now turned the prc bands back down...10 min still flat ...for now
Anyone who took the short at 1793 is being well rewarded
Great call, Kool!
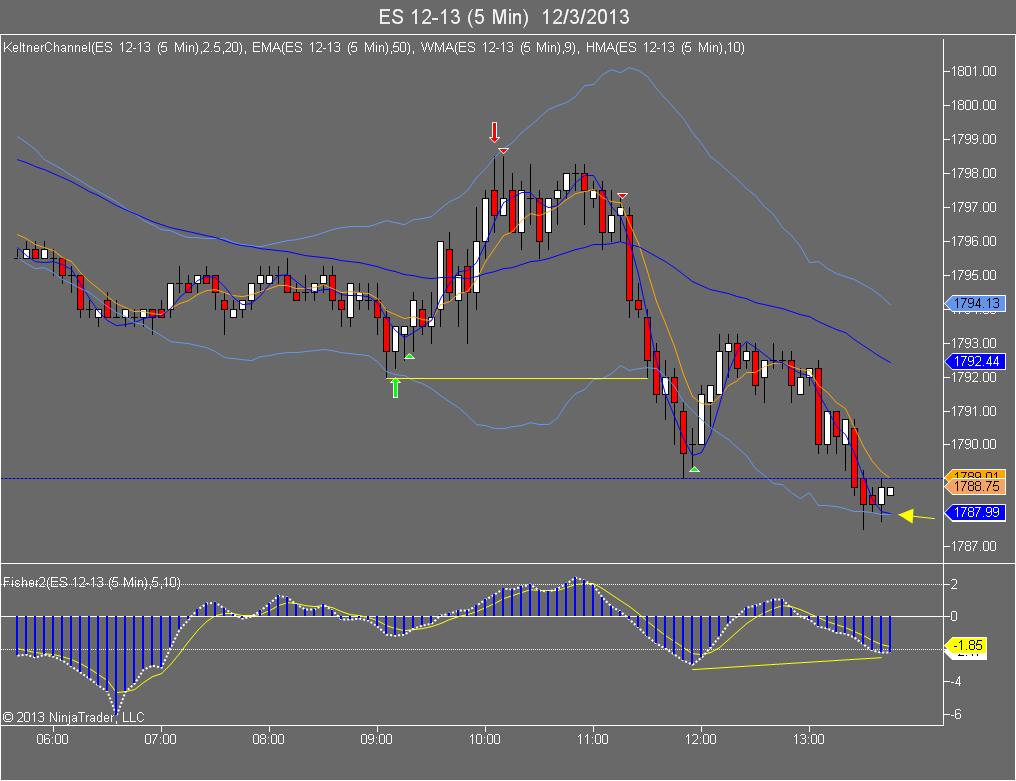
5 minute keltner trying to hold with a possible bullish fish divergence forming...
Click image for original size
Click image for original size
...
Emini Day Trading /
Daily Notes /
Forecast /
Economic Events /
Search /
Terms and Conditions /
Disclaimer /
Books /
Online Books /
Site Map /
Contact /
Privacy Policy /
Links /
About /
Day Trading Forum /
Investment Calculators /
Pivot Point Calculator /
Market Profile Generator /
Fibonacci Calculator /
Mailing List /
Advertise Here /
Articles /
Financial Terms /
Brokers /
Software /
Holidays /
Stock Split Calendar /
Mortgage Calculator /
Donate
Copyright © 2004-2023, MyPivots. All rights reserved.
Copyright © 2004-2023, MyPivots. All rights reserved.