ES Friday 2-21-14
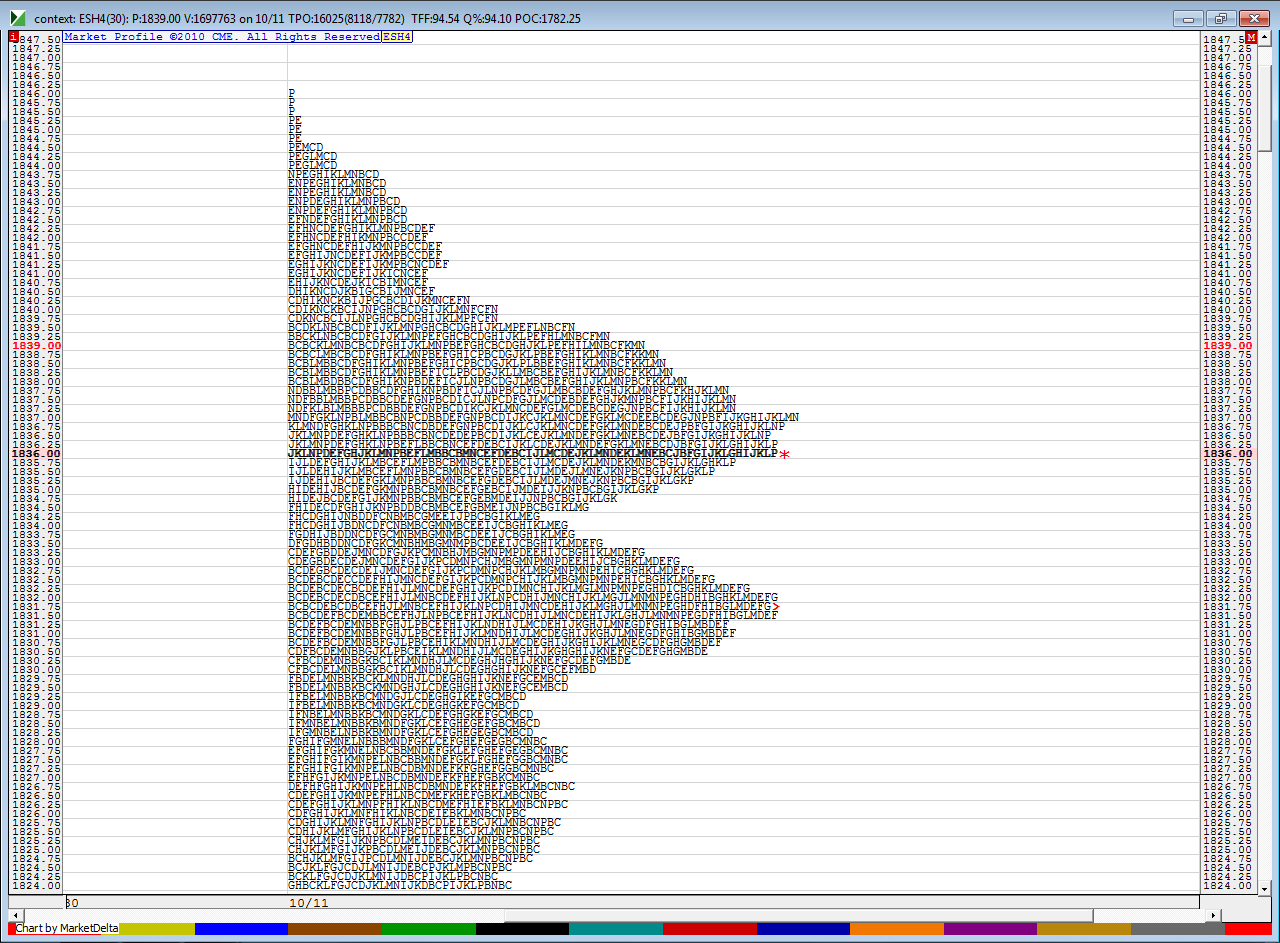
first some context....do they need to fill in the low volume spot and round out a bell curve before making consistent new highs and keep rallying ? that would imply trade back into the 34 area
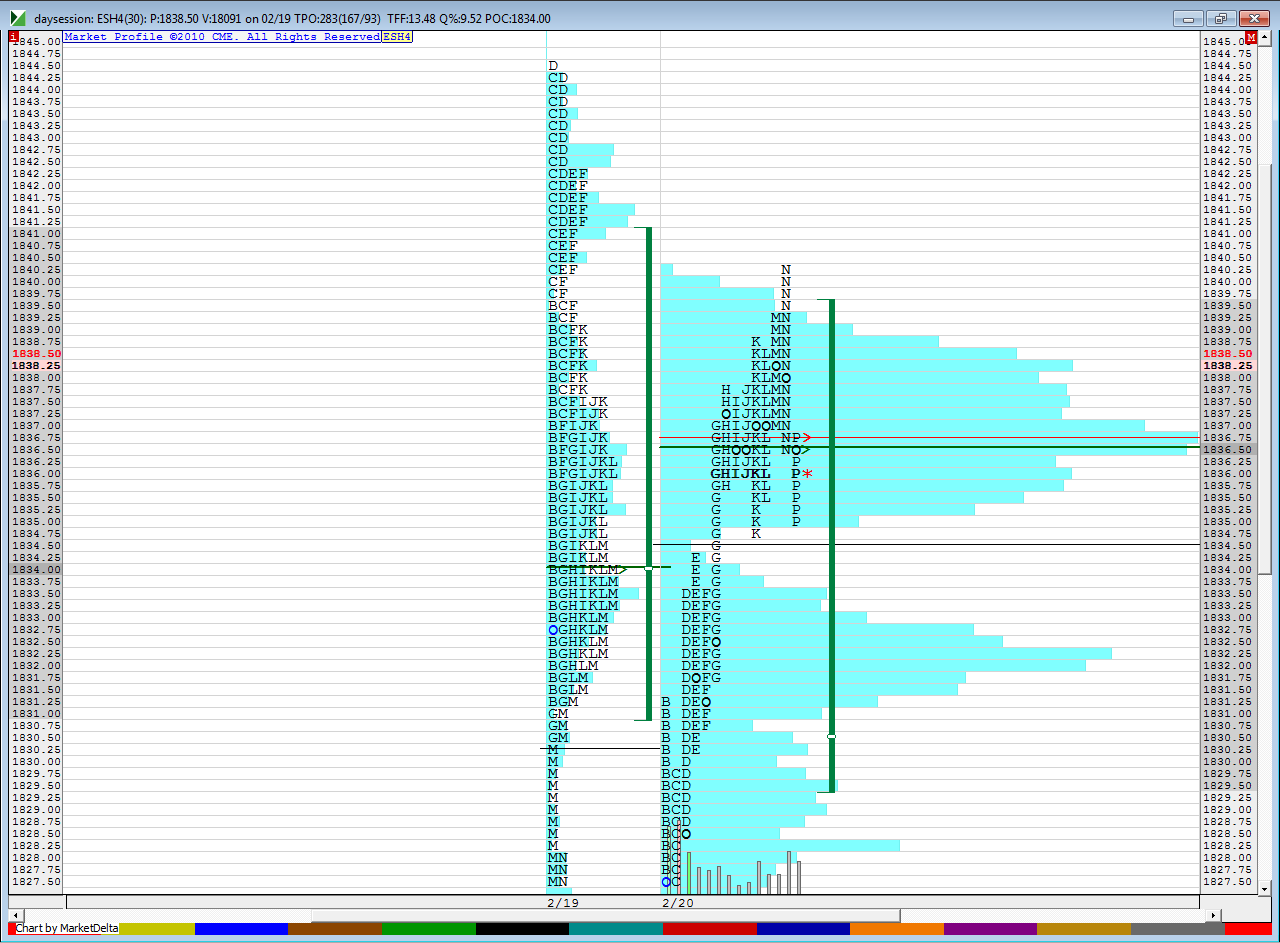
next we have the last two days...note single prints at 34.50.....we have two distinct bell curves from Thursday
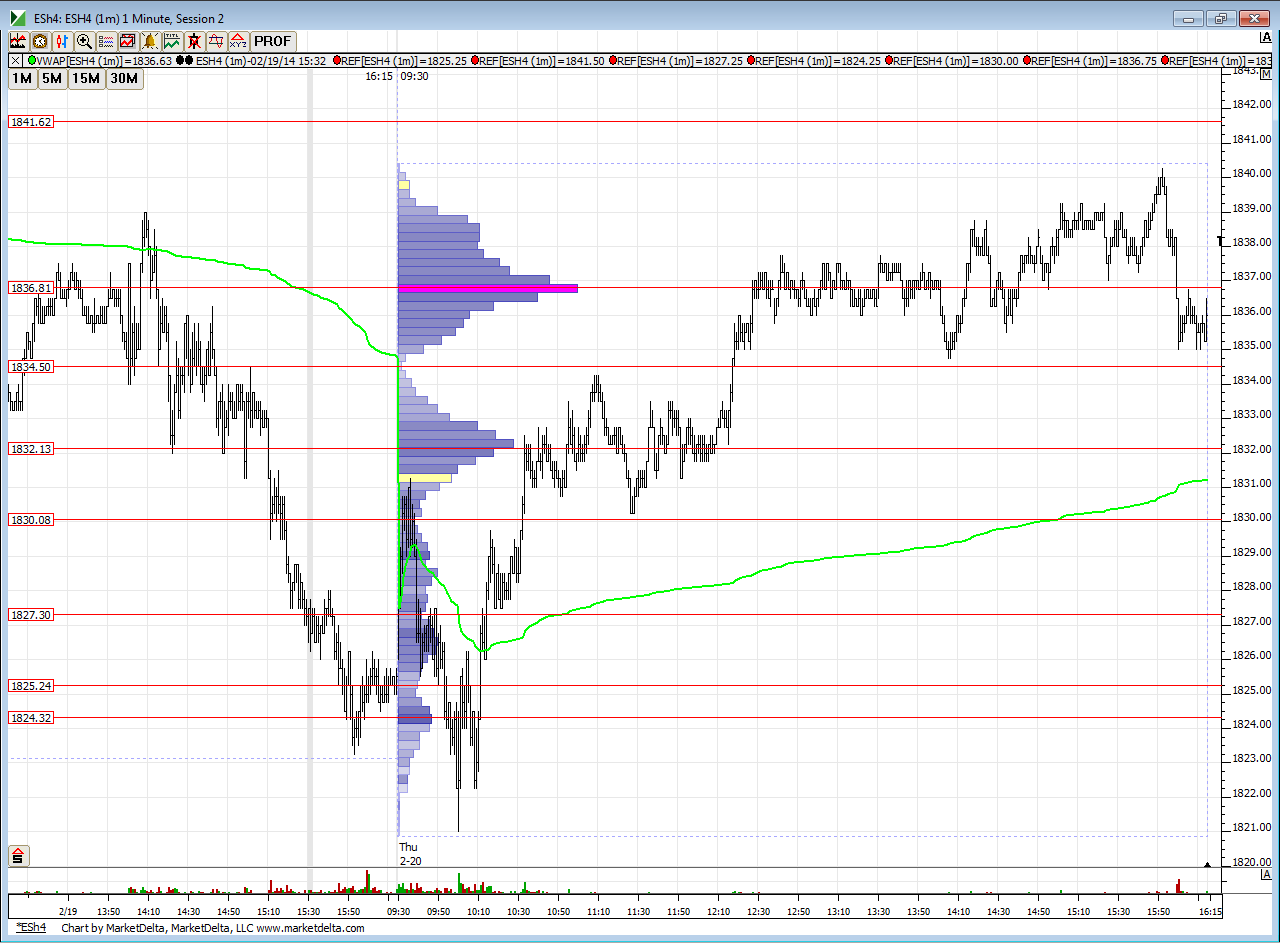
here is just yesterday as per time
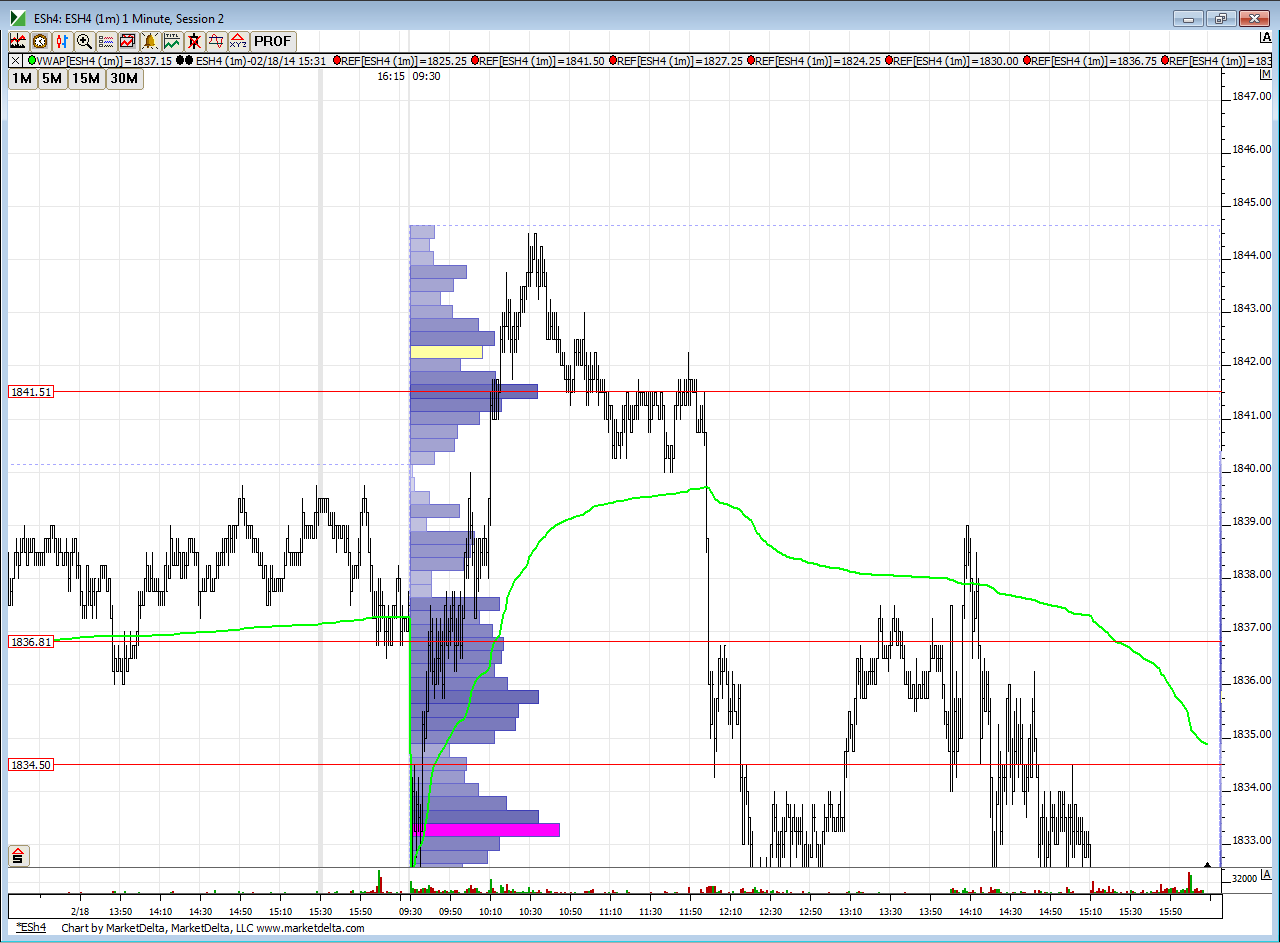
finally the overnight against yesterday...note how POC/vpoc is at YD VA high and O/N low is right near the singles from yesterday
most overnight traders are long which usually implies some form of correction unless big volume comes in...I want to try and sell that 40 area especially if we open in Value today or buy that 34 and that 32 area....I had volume from Wednesday at 41.50 and 42.75 so the key upper zone runs from 40 - 42.75
here is what that upper part of tuesday looks like
Click image for original size
next we have the last two days...note single prints at 34.50.....we have two distinct bell curves from Thursday
Click image for original size
here is just yesterday as per time
Click image for original size
finally the overnight against yesterday...note how POC/vpoc is at YD VA high and O/N low is right near the singles from yesterday
Click image for original size
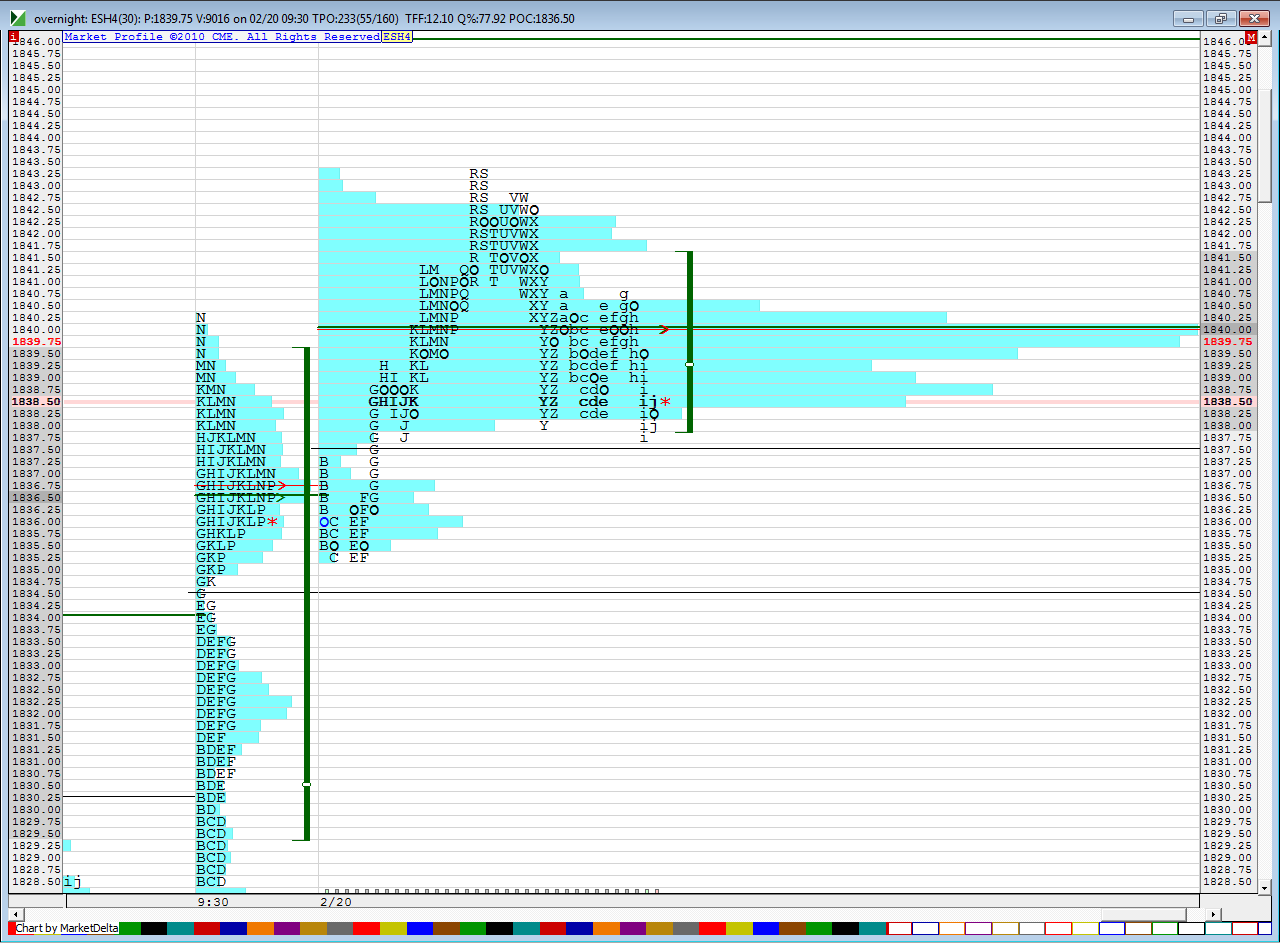
most overnight traders are long which usually implies some form of correction unless big volume comes in...I want to try and sell that 40 area especially if we open in Value today or buy that 34 and that 32 area....I had volume from Wednesday at 41.50 and 42.75 so the key upper zone runs from 40 - 42.75
here is what that upper part of tuesday looks like
Click image for original size
great...and experiment with it...you may like range charts or 3 minute etc....
never a good thing if we start getting double or triple tpo prints in LVN's...u want to see rejection that never looks back....seems like they may want to eventually fill in that 34.50 from first chart today......nice how the bigger time frame confirmed the chart from yesterdays day session...that first chart today was a 30 minute composite that started way back in October of 2013......just time !!! cool stuff
never a good thing if we start getting double or triple tpo prints in LVN's...u want to see rejection that never looks back....seems like they may want to eventually fill in that 34.50 from first chart today......nice how the bigger time frame confirmed the chart from yesterdays day session...that first chart today was a 30 minute composite that started way back in October of 2013......just time !!! cool stuff
Originally posted by apk781
Got it. Thanks !
Emini Day Trading /
Daily Notes /
Forecast /
Economic Events /
Search /
Terms and Conditions /
Disclaimer /
Books /
Online Books /
Site Map /
Contact /
Privacy Policy /
Links /
About /
Day Trading Forum /
Investment Calculators /
Pivot Point Calculator /
Market Profile Generator /
Fibonacci Calculator /
Mailing List /
Advertise Here /
Articles /
Financial Terms /
Brokers /
Software /
Holidays /
Stock Split Calendar /
Mortgage Calculator /
Donate
Copyright © 2004-2023, MyPivots. All rights reserved.
Copyright © 2004-2023, MyPivots. All rights reserved.