ES Friday 11-14-14
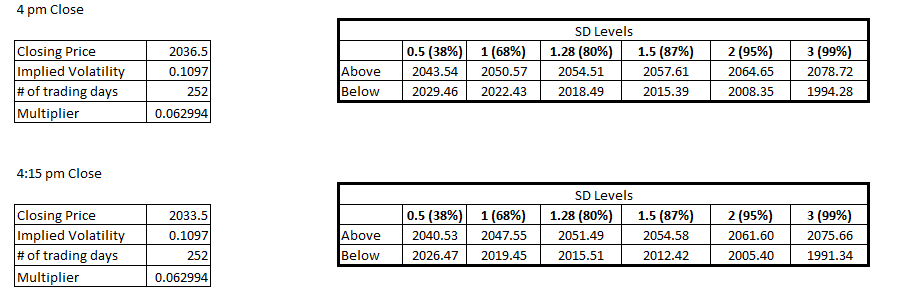
YD we hit both the upper and lower 1/2 bands using both the 4pm and 4:15pm close. As a matter of fact, the high and low of the day were ~1 point away from the bands.
Today we have the 4pm and 4:15pm bands 3 points apart so I will be focusing more on the 4pm bands just because they are tighter.
Today we have the 4pm and 4:15pm bands 3 points apart so I will be focusing more on the 4pm bands just because they are tighter.
Click image for original size
seems like today would be a good day to wait until reports are all cleared out at 10 a.m to start looking........or else go smaller in your zones pre- report...we are set to open in range of YD va and also the O/N VA......so like paul has said this could be prone for a breakout...
short 37.50..tryinfg for midpoint
waiting for reports now
Bruce, I am disappointed. I watched both videos for the grumpiness to show up, but it never did! Just kidding. There is nothing at all for you to apologize for.
Your videos are a fantastic resource and I study them multiple times to learn from them. And I learn new things everytime I watch them!
I have looked at swing highs and lows in the past but like you said, we all need a reminder from time to time on it and I will definitely be looking at it more closely now!
Thanks as always
They are trying real hard to break through 37.5. I think that will decide the direction of the rest of the day...
Yes...you are doing all of us a favour just by sharing whatever insights you have. This little group is lost without you and that's a fact. Thank you a million times over. I am trying to learn everything but it seems so difficult as you seem to come up with new things everyday! Your work here is fantastic, I don't say it enough.
i'm using 39.75 - 41 as a sub zone.....( center of YD upper bell and weekly r1)..but that 43 area up top would be better......single below on 30 minute break out would be target...higher risk due to tight coiling
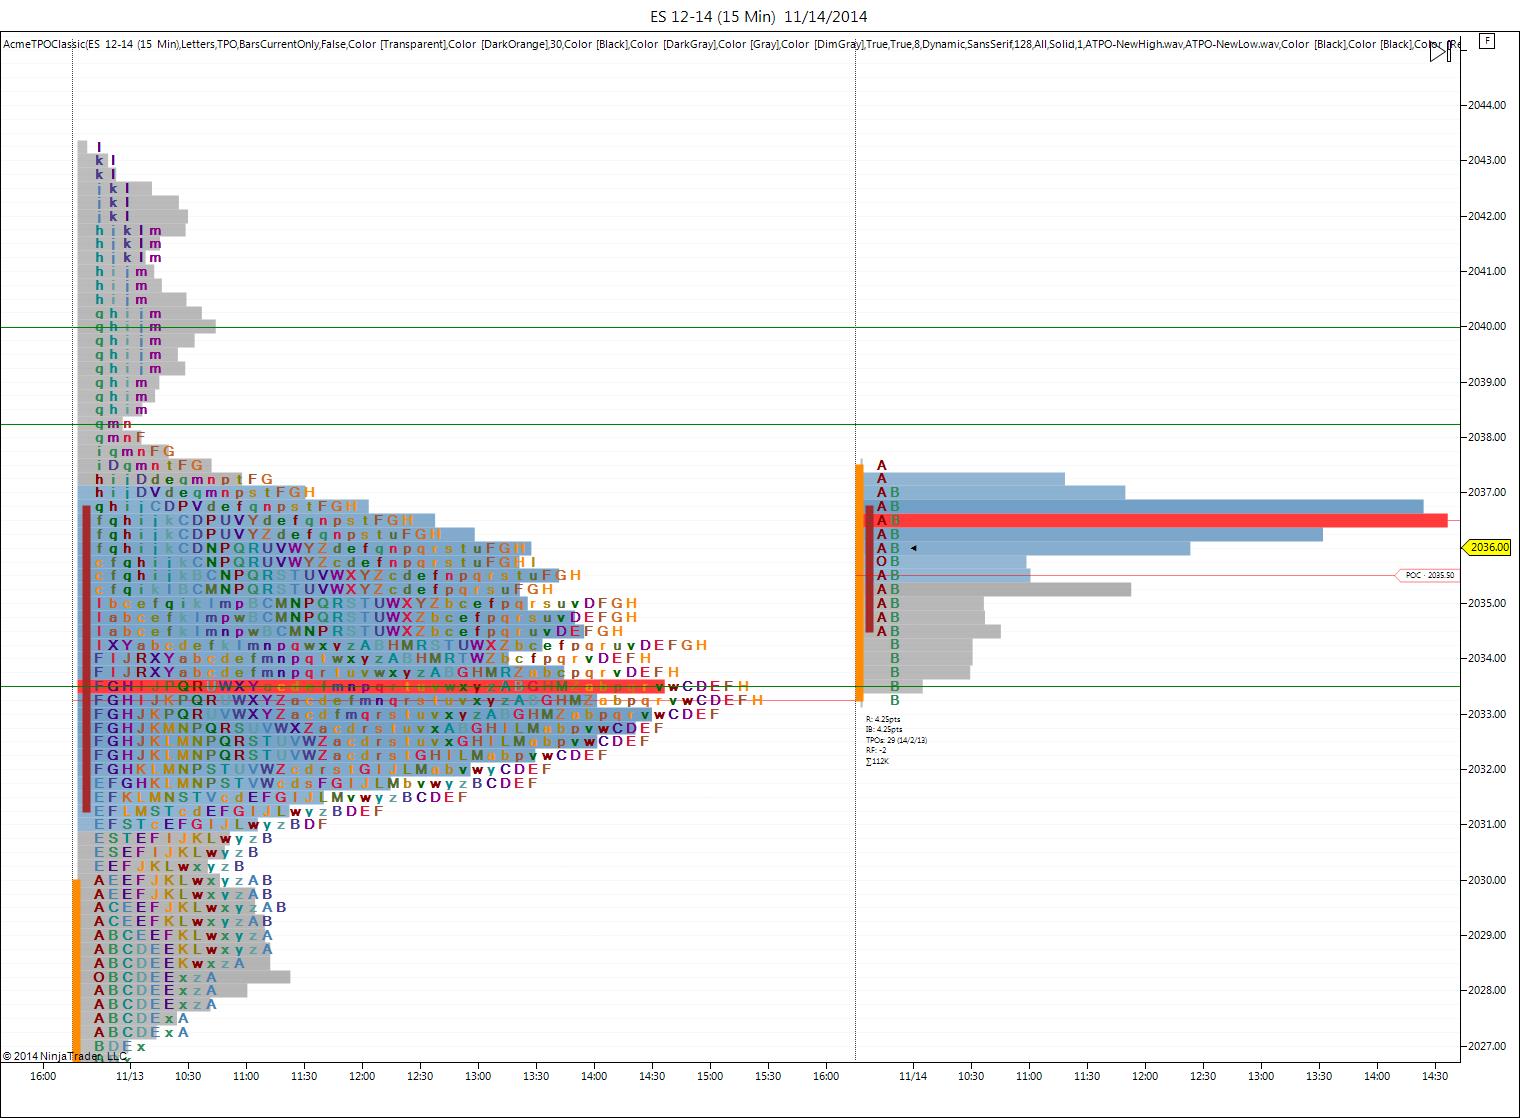
lvn at 37.50.....today...sharks chart shows the upper bell center nicely
Weekly R1 @ 39.25 again proves to be strong resistance
Bruce i know u were asking abt what was going on with 32 that stopped the market many times...i had (and still have) the developing weekly midpoint at 32.5 (24hrd chart)...i usually look at both rth and 24hr when looking at weekly stats since many times we make a siginificant low or high in a week during o/n that skews things a bit wrt to the rth chart..here the link tot he chart fwiw
http://www.charthub.com/charts/2014/11/14/es_main_15m_141114121732
http://www.charthub.com/charts/2014/11/14/es_main_15m_141114121732
Emini Day Trading /
Daily Notes /
Forecast /
Economic Events /
Search /
Terms and Conditions /
Disclaimer /
Books /
Online Books /
Site Map /
Contact /
Privacy Policy /
Links /
About /
Day Trading Forum /
Investment Calculators /
Pivot Point Calculator /
Market Profile Generator /
Fibonacci Calculator /
Mailing List /
Advertise Here /
Articles /
Financial Terms /
Brokers /
Software /
Holidays /
Stock Split Calendar /
Mortgage Calculator /
Donate
Copyright © 2004-2023, MyPivots. All rights reserved.
Copyright © 2004-2023, MyPivots. All rights reserved.